Free Access
Fig. 12
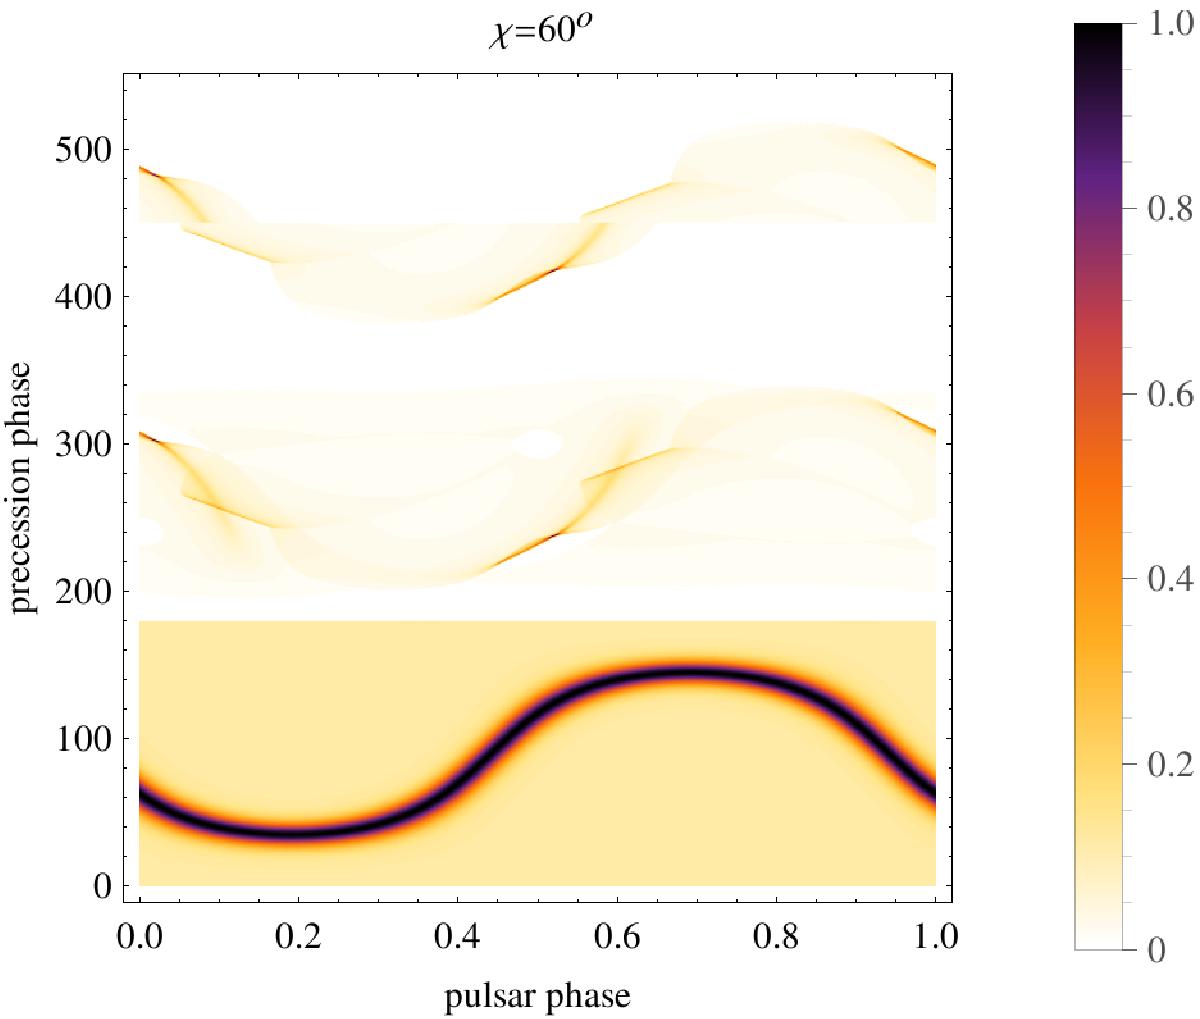
Phase plot diagram for our striped-wind model, in the lower panel for ζ ∈ [0°,180°], the two-pole caustic model in the middle panel for ζ ∈ [180°,360°], and the outer-gap model in the upper panel for ζ ∈ [360°,540°]. The plots have been artificially shifted to place them in one graph. The pulsar obliquity is χ = 60°.
Current usage metrics show cumulative count of Article Views (full-text article views including HTML views, PDF and ePub downloads, according to the available data) and Abstracts Views on Vision4Press platform.
Data correspond to usage on the plateform after 2015. The current usage metrics is available 48-96 hours after online publication and is updated daily on week days.
Initial download of the metrics may take a while.