Free Access
Fig. 10
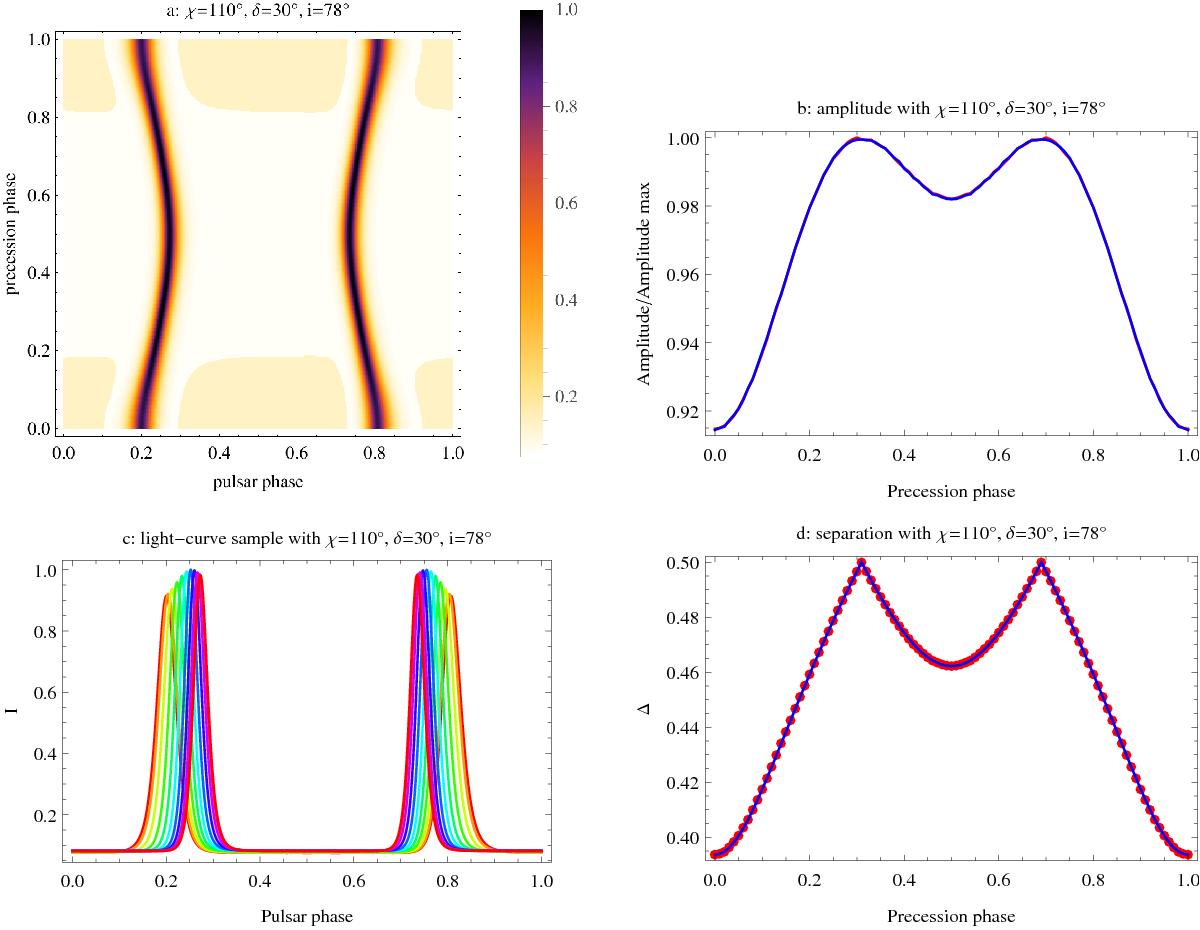
Detailed analysis of the evolution of the pulsed emission from PSR B1534+12. From left to right and top to bottom, we show the pulse profiles, the amplitude of the peak intensity, the width of the pulses, and the separation of the two peaks.
This figure is made of several images, please see below:
Current usage metrics show cumulative count of Article Views (full-text article views including HTML views, PDF and ePub downloads, according to the available data) and Abstracts Views on Vision4Press platform.
Data correspond to usage on the plateform after 2015. The current usage metrics is available 48-96 hours after online publication and is updated daily on week days.
Initial download of the metrics may take a while.