Fig. 3
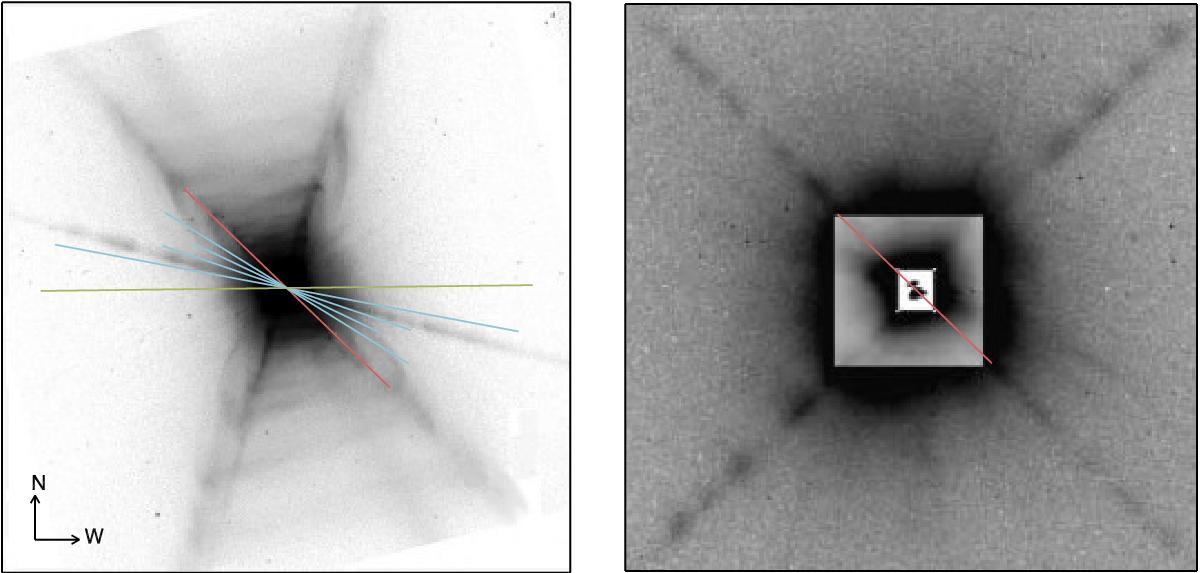
Backgroud image of the Red Rectangle protoplanetary nebula as seen in the red (left panel; taken from Koning et al. 2011) and in the blue (right panel; taken from Cohen et al. 2004). The lines represent the direction of the polarisation of the continuum (red), the Balmer lines (blue) and the Ca ii K line (green). The size of the lines represents the degree polarisation with respect to the continuum value.
Current usage metrics show cumulative count of Article Views (full-text article views including HTML views, PDF and ePub downloads, according to the available data) and Abstracts Views on Vision4Press platform.
Data correspond to usage on the plateform after 2015. The current usage metrics is available 48-96 hours after online publication and is updated daily on week days.
Initial download of the metrics may take a while.