Free Access
Fig. 2
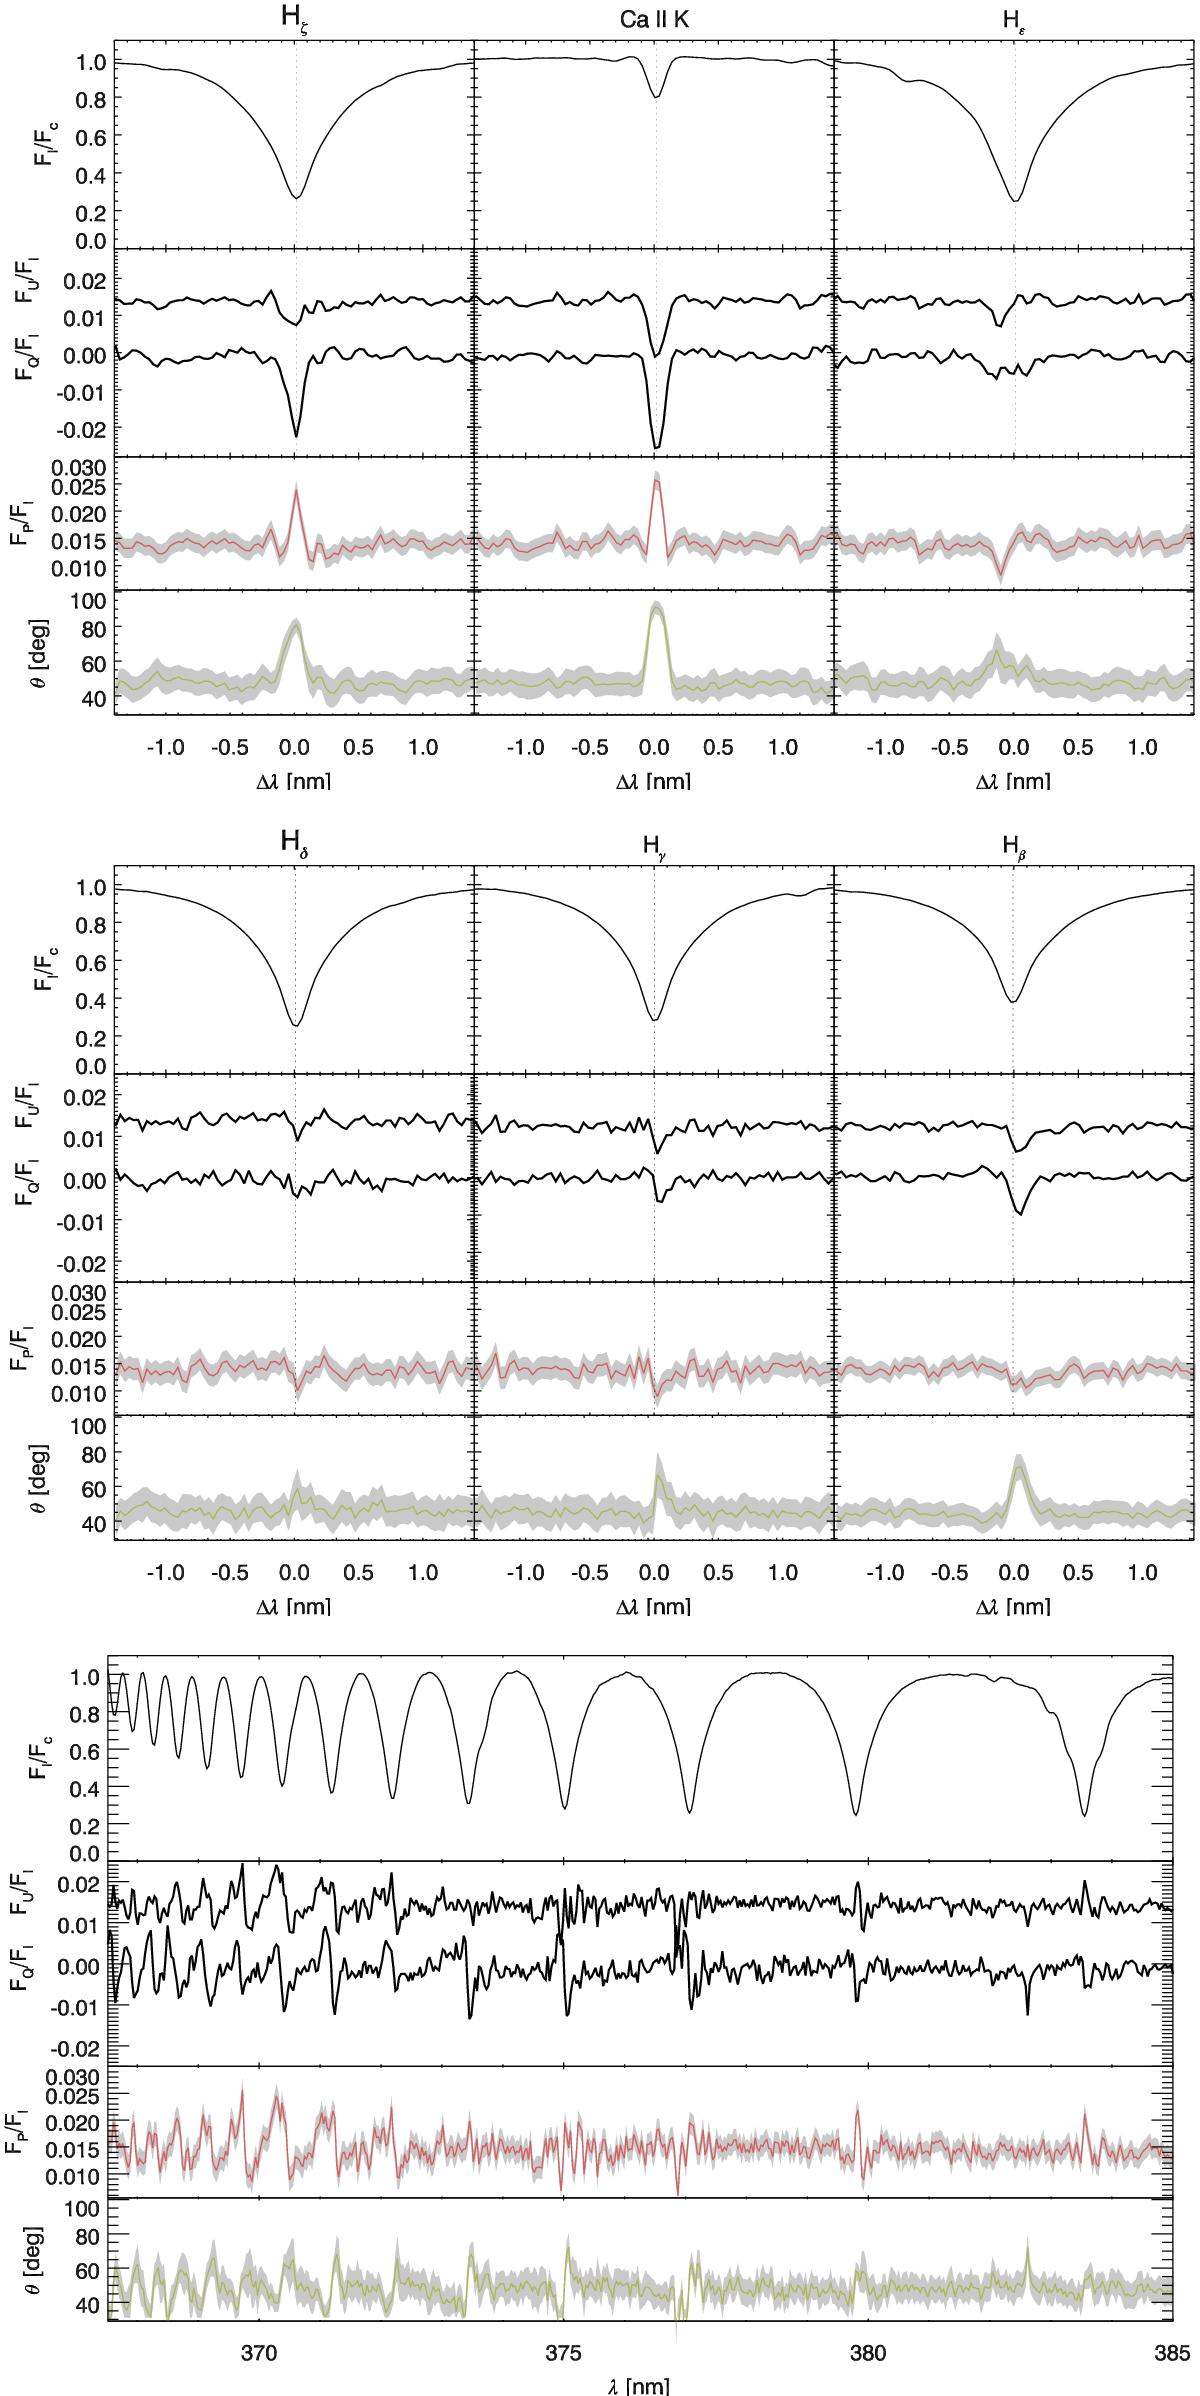
Close look to the Balmer lines and the Ca ii K line. From top to bottom, the spectra of the intensity flux, the flux of the Stokes Q and U parameters in terms of the intensity flux, the polarisation degree, and the polarisation angle. The shadowed areas represent the 2-sigma confidence level for these derived quantities.
This figure is made of several images, please see below:
Current usage metrics show cumulative count of Article Views (full-text article views including HTML views, PDF and ePub downloads, according to the available data) and Abstracts Views on Vision4Press platform.
Data correspond to usage on the plateform after 2015. The current usage metrics is available 48-96 hours after online publication and is updated daily on week days.
Initial download of the metrics may take a while.