Fig. 4
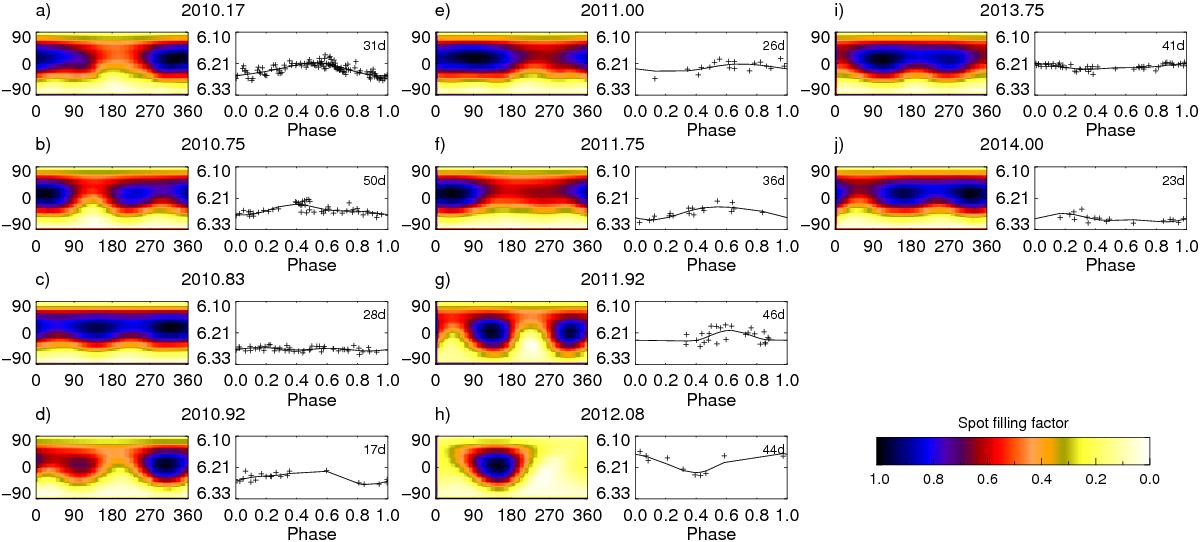
Each data subset (a–j) is visualised with two images. The given times represent the middle point of each set. On the left, we show the light-curve inversion result. The spot-filling factor is larger in the darker regions. A light curve represents a one-dimensional time series and, therefore, the resulting stellar image contains information on the spot distribution only in longitudinal direction. On the right, the observed and calculated V-band magnitudes are plotted with crosses and lines, respectively. The length of the set (in days) is given in the upper right corner.
Current usage metrics show cumulative count of Article Views (full-text article views including HTML views, PDF and ePub downloads, according to the available data) and Abstracts Views on Vision4Press platform.
Data correspond to usage on the plateform after 2015. The current usage metrics is available 48-96 hours after online publication and is updated daily on week days.
Initial download of the metrics may take a while.