Fig. 1
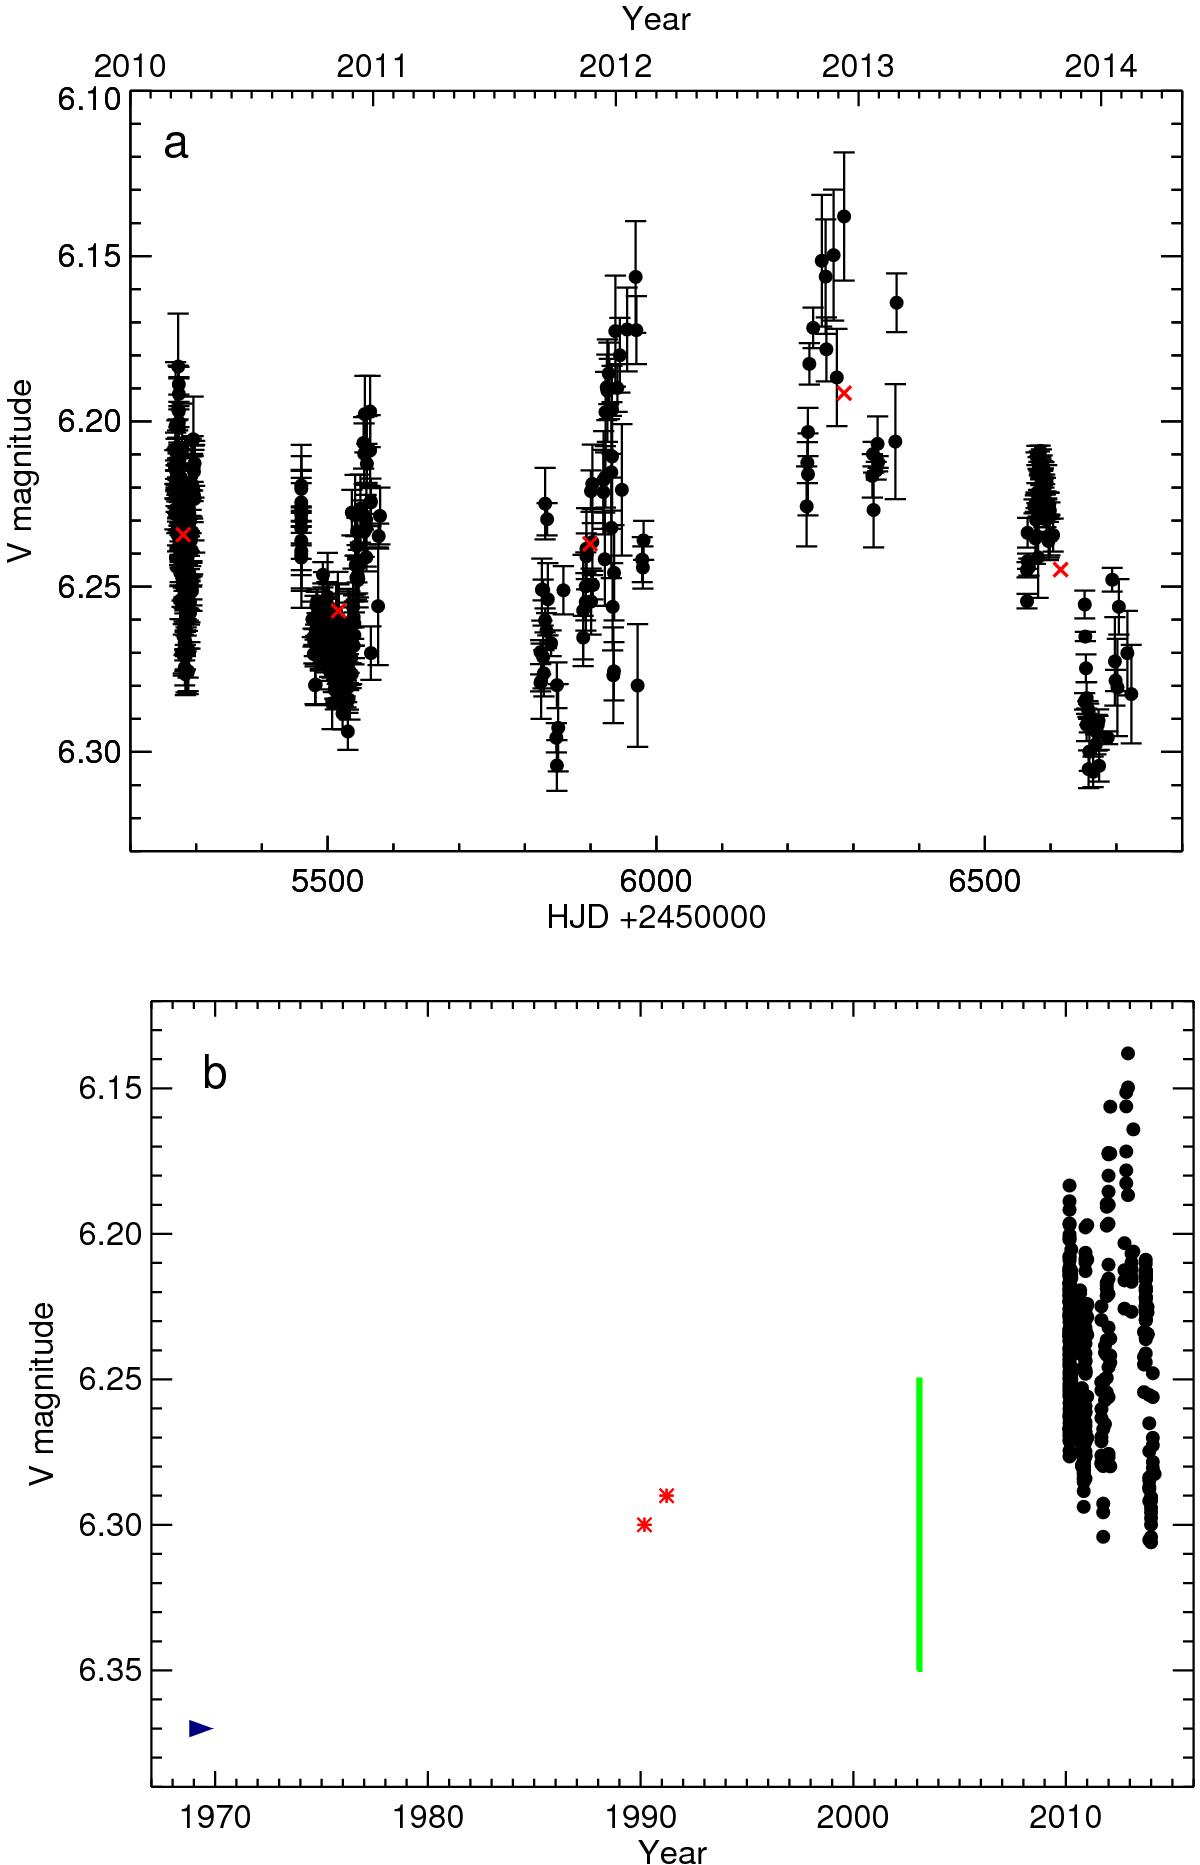
a)V-band photometric data of AF Lep with measurement errors used in this paper. The mean value of each observing season is plotted with red x. b) The whole photometric record in the V-band: the blue arrowhead represents data from Stokes (1972), the red asterisks data from Cutispoto et al. (1996), the green bar illustrates the magnitude range from Budding et al. (2003), and black dots represent this work.
Current usage metrics show cumulative count of Article Views (full-text article views including HTML views, PDF and ePub downloads, according to the available data) and Abstracts Views on Vision4Press platform.
Data correspond to usage on the plateform after 2015. The current usage metrics is available 48-96 hours after online publication and is updated daily on week days.
Initial download of the metrics may take a while.