Fig. 7
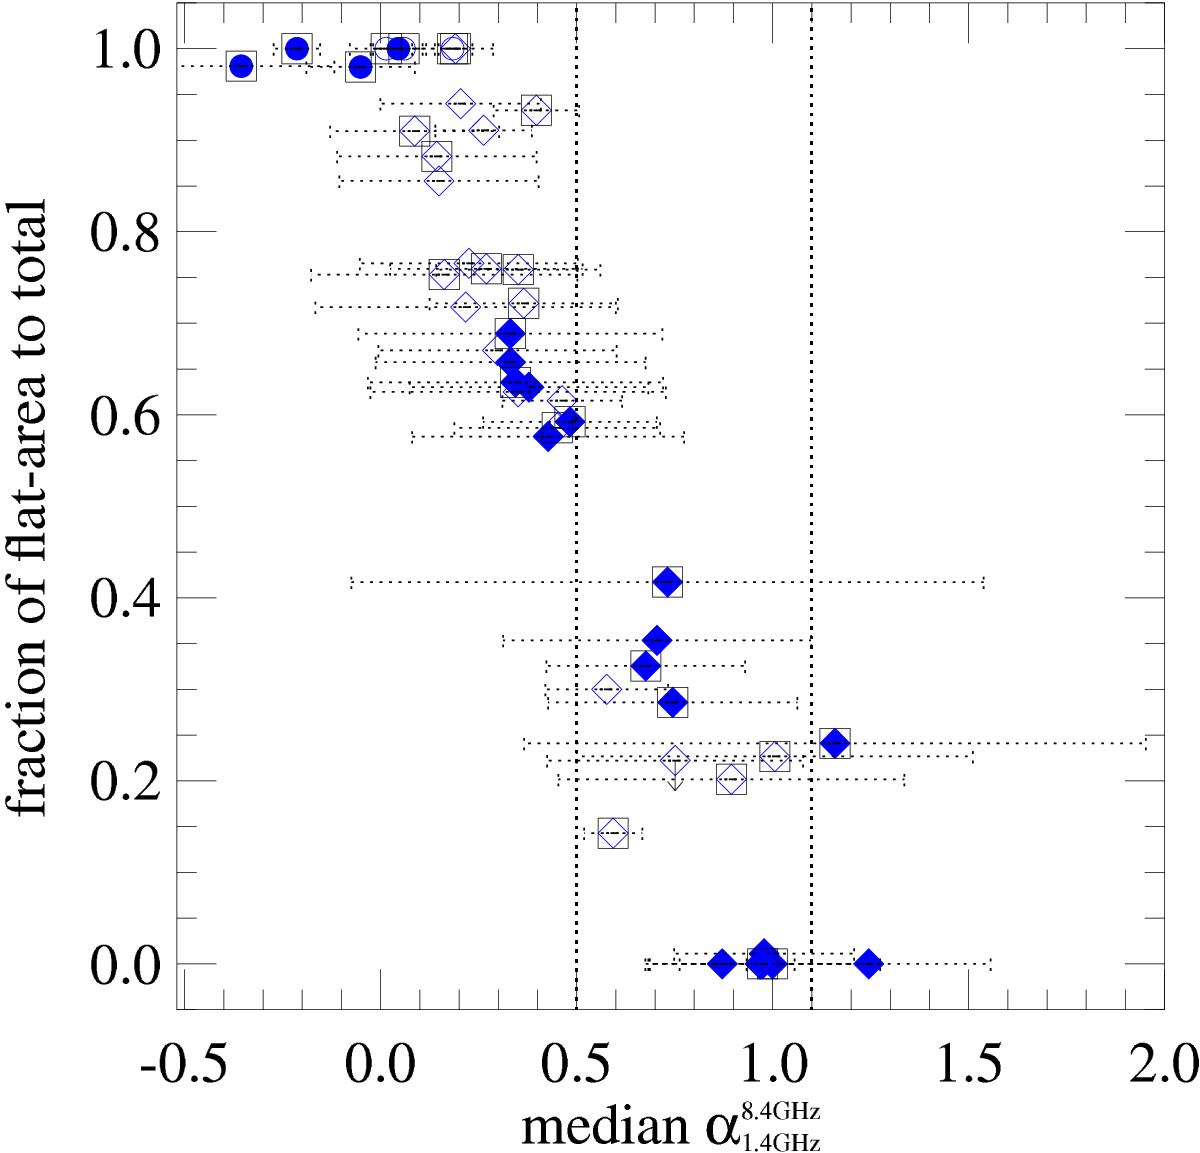
The ratio of size of the area corresponding to flat radio spectral index (in kpc2) as in Table 5, to the total radio size as in the α-maps versus median radio spectral index calculated from the α-maps. The dispersion (standard deviation) around the median is shown with horizontal dotter error-bars. Symbols: blue open diamonds denote the objects of our sample, blue filled diamonds denote objects that are classified as radio-AGN based on the α-maps, and black squares denote objects that have an AGN contribution in their mid-IR luminosity (Petric et al. 2011); unresolved objects are marked with circles instead of diamonds. The vertical dotted lines at 0.5 and 1.1 mark the flat-steep division and the limit above where we do not expect steepening from compact starburst, respectively.
Current usage metrics show cumulative count of Article Views (full-text article views including HTML views, PDF and ePub downloads, according to the available data) and Abstracts Views on Vision4Press platform.
Data correspond to usage on the plateform after 2015. The current usage metrics is available 48-96 hours after online publication and is updated daily on week days.
Initial download of the metrics may take a while.