Fig. 6
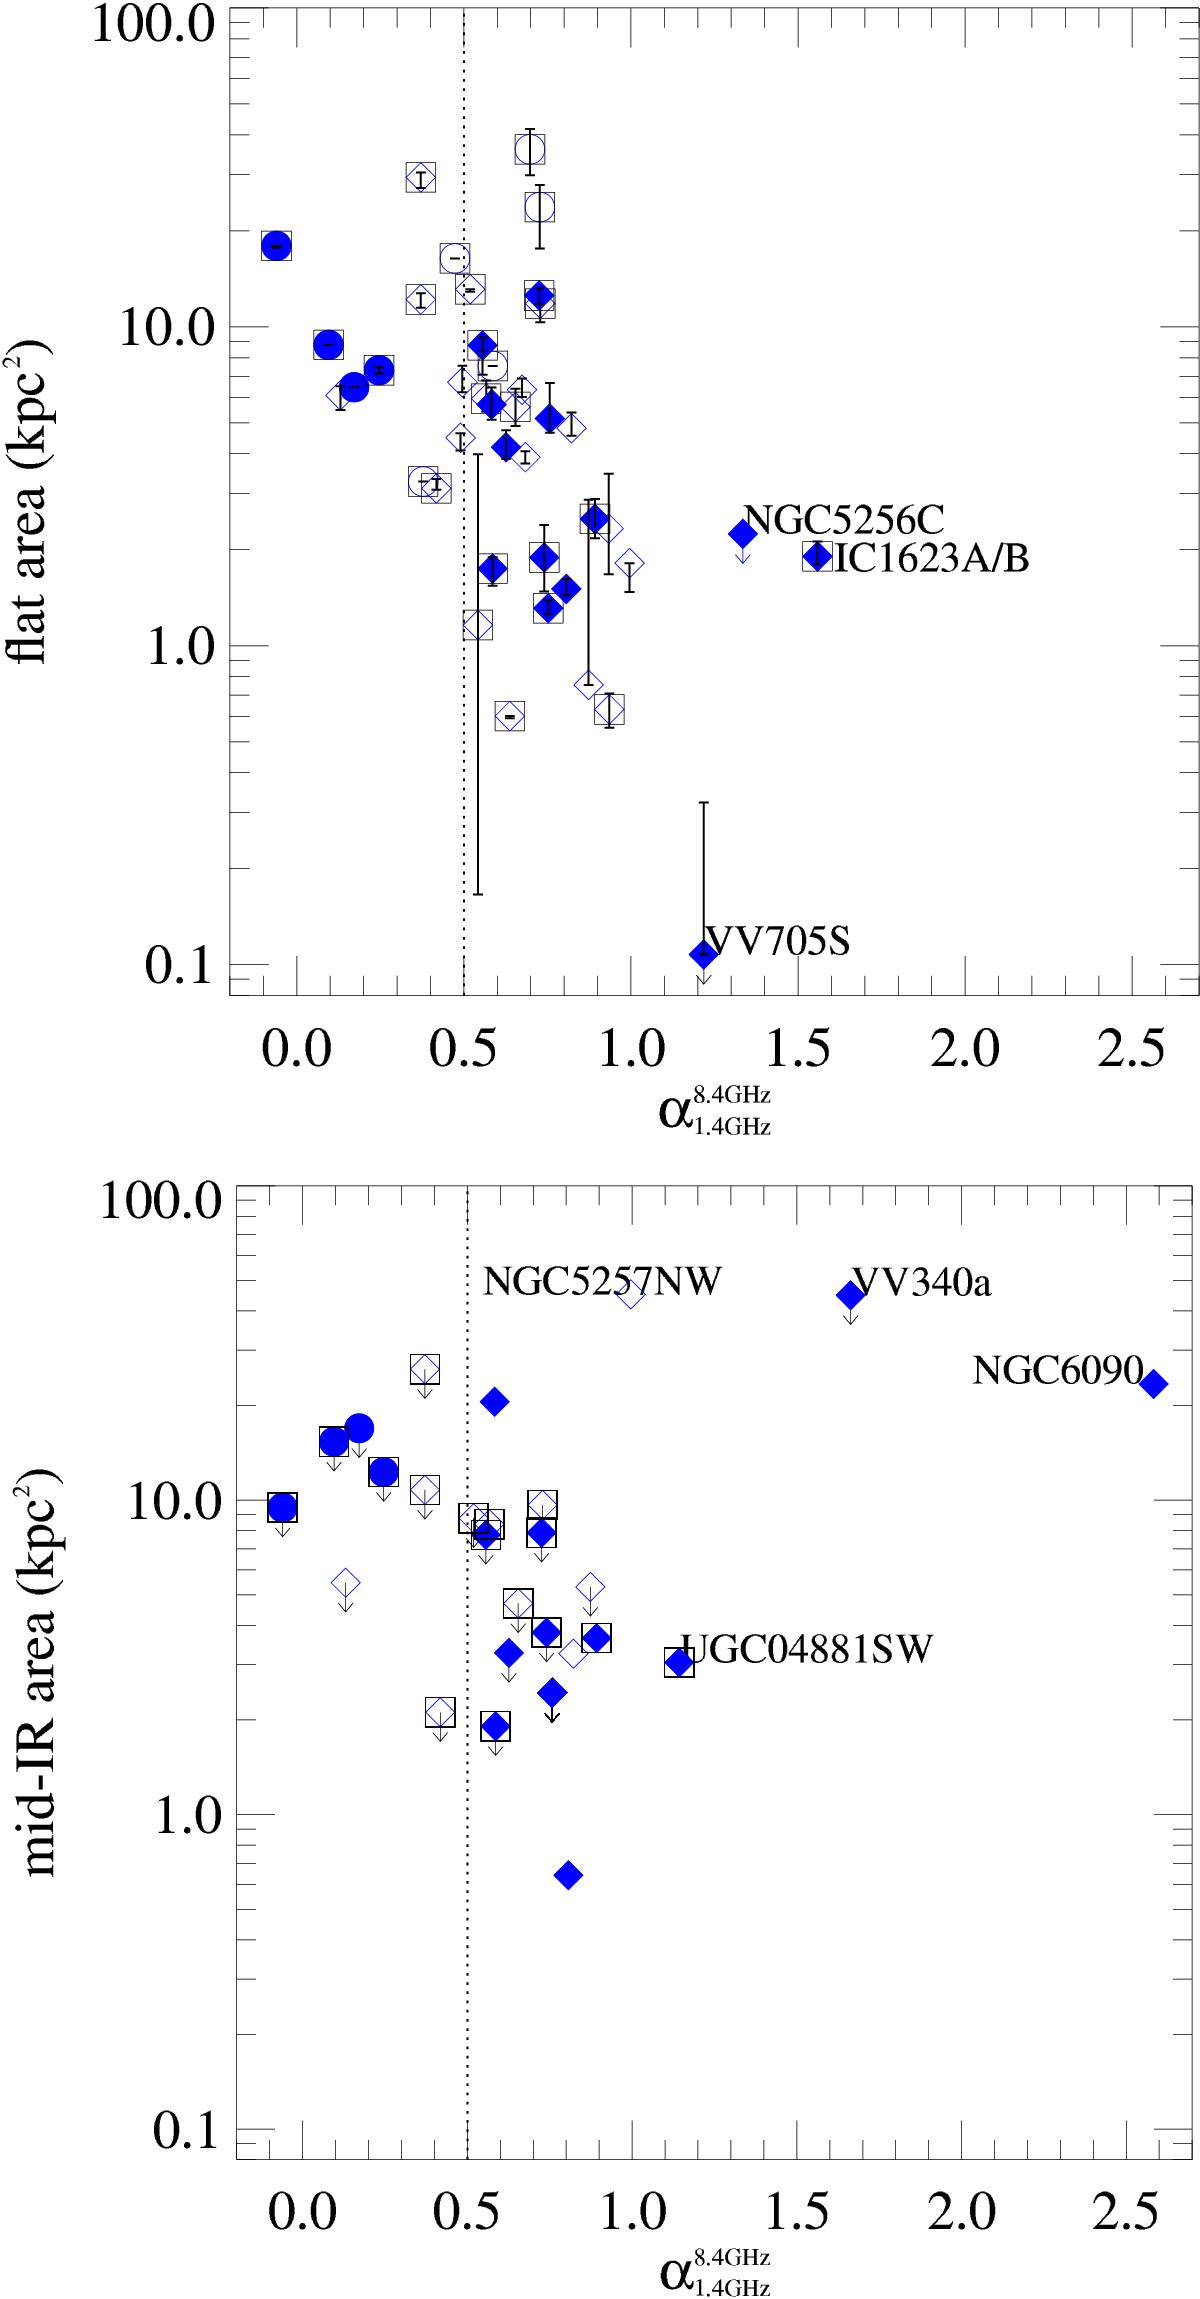
Top: size of area corresponding to flat radio spectral index (in kpc2) versus integrated radio spectral index calculated between 1.49 and 8.44 GHz. The dotted horizontal line marks the flat to steep division in radio spectral index. The Spearman ρ = −0.317 with 4% probability that the correlation is not present. Bottom: mid-IR area in kpc2 of the core of mid-IR emission, assuming emission from a circular area (see Sect. 4.3), versus integrated radio spectral index (see Table 1). The Spearman ρ = −0.189 with 21% probability that the correlation is not present. In both plots, the dotted vertical line marks the flat to steep division in the radio spectral index. Symbols as in Fig. 3; unresolved objects are marked with circles instead of diamonds.
Current usage metrics show cumulative count of Article Views (full-text article views including HTML views, PDF and ePub downloads, according to the available data) and Abstracts Views on Vision4Press platform.
Data correspond to usage on the plateform after 2015. The current usage metrics is available 48-96 hours after online publication and is updated daily on week days.
Initial download of the metrics may take a while.