Fig. 5
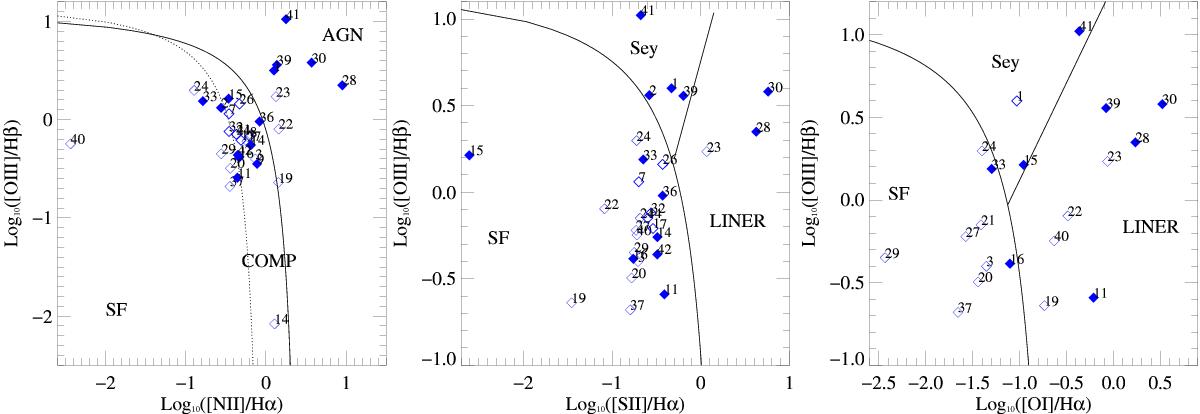
BPT diagrams showing emission line ratios [OIII]/Hβ versus [NII]/Hα (left), [SII]/Hα (middle) and [OI]/Hα (right). In all figures, the blue diamonds represent the 46 individual objects in our sample, where objects identified as radio-AGN based on the α-maps are shown as filled blue diamonds (see Table 4). Numbers next to the symbols represent the objects in our sample as given in Table 1. On the left graph, the solid and dotted lines separate the SF galaxies from the AGN and mark the area where composites (COMP) are located (Kauffmann et al. 2003). The solid lines on the middle and right graphs are from Kewley et al. (2006) and separate the SF from Seyfert (Sey) and LINERs.
Current usage metrics show cumulative count of Article Views (full-text article views including HTML views, PDF and ePub downloads, according to the available data) and Abstracts Views on Vision4Press platform.
Data correspond to usage on the plateform after 2015. The current usage metrics is available 48-96 hours after online publication and is updated daily on week days.
Initial download of the metrics may take a while.