Fig. 4
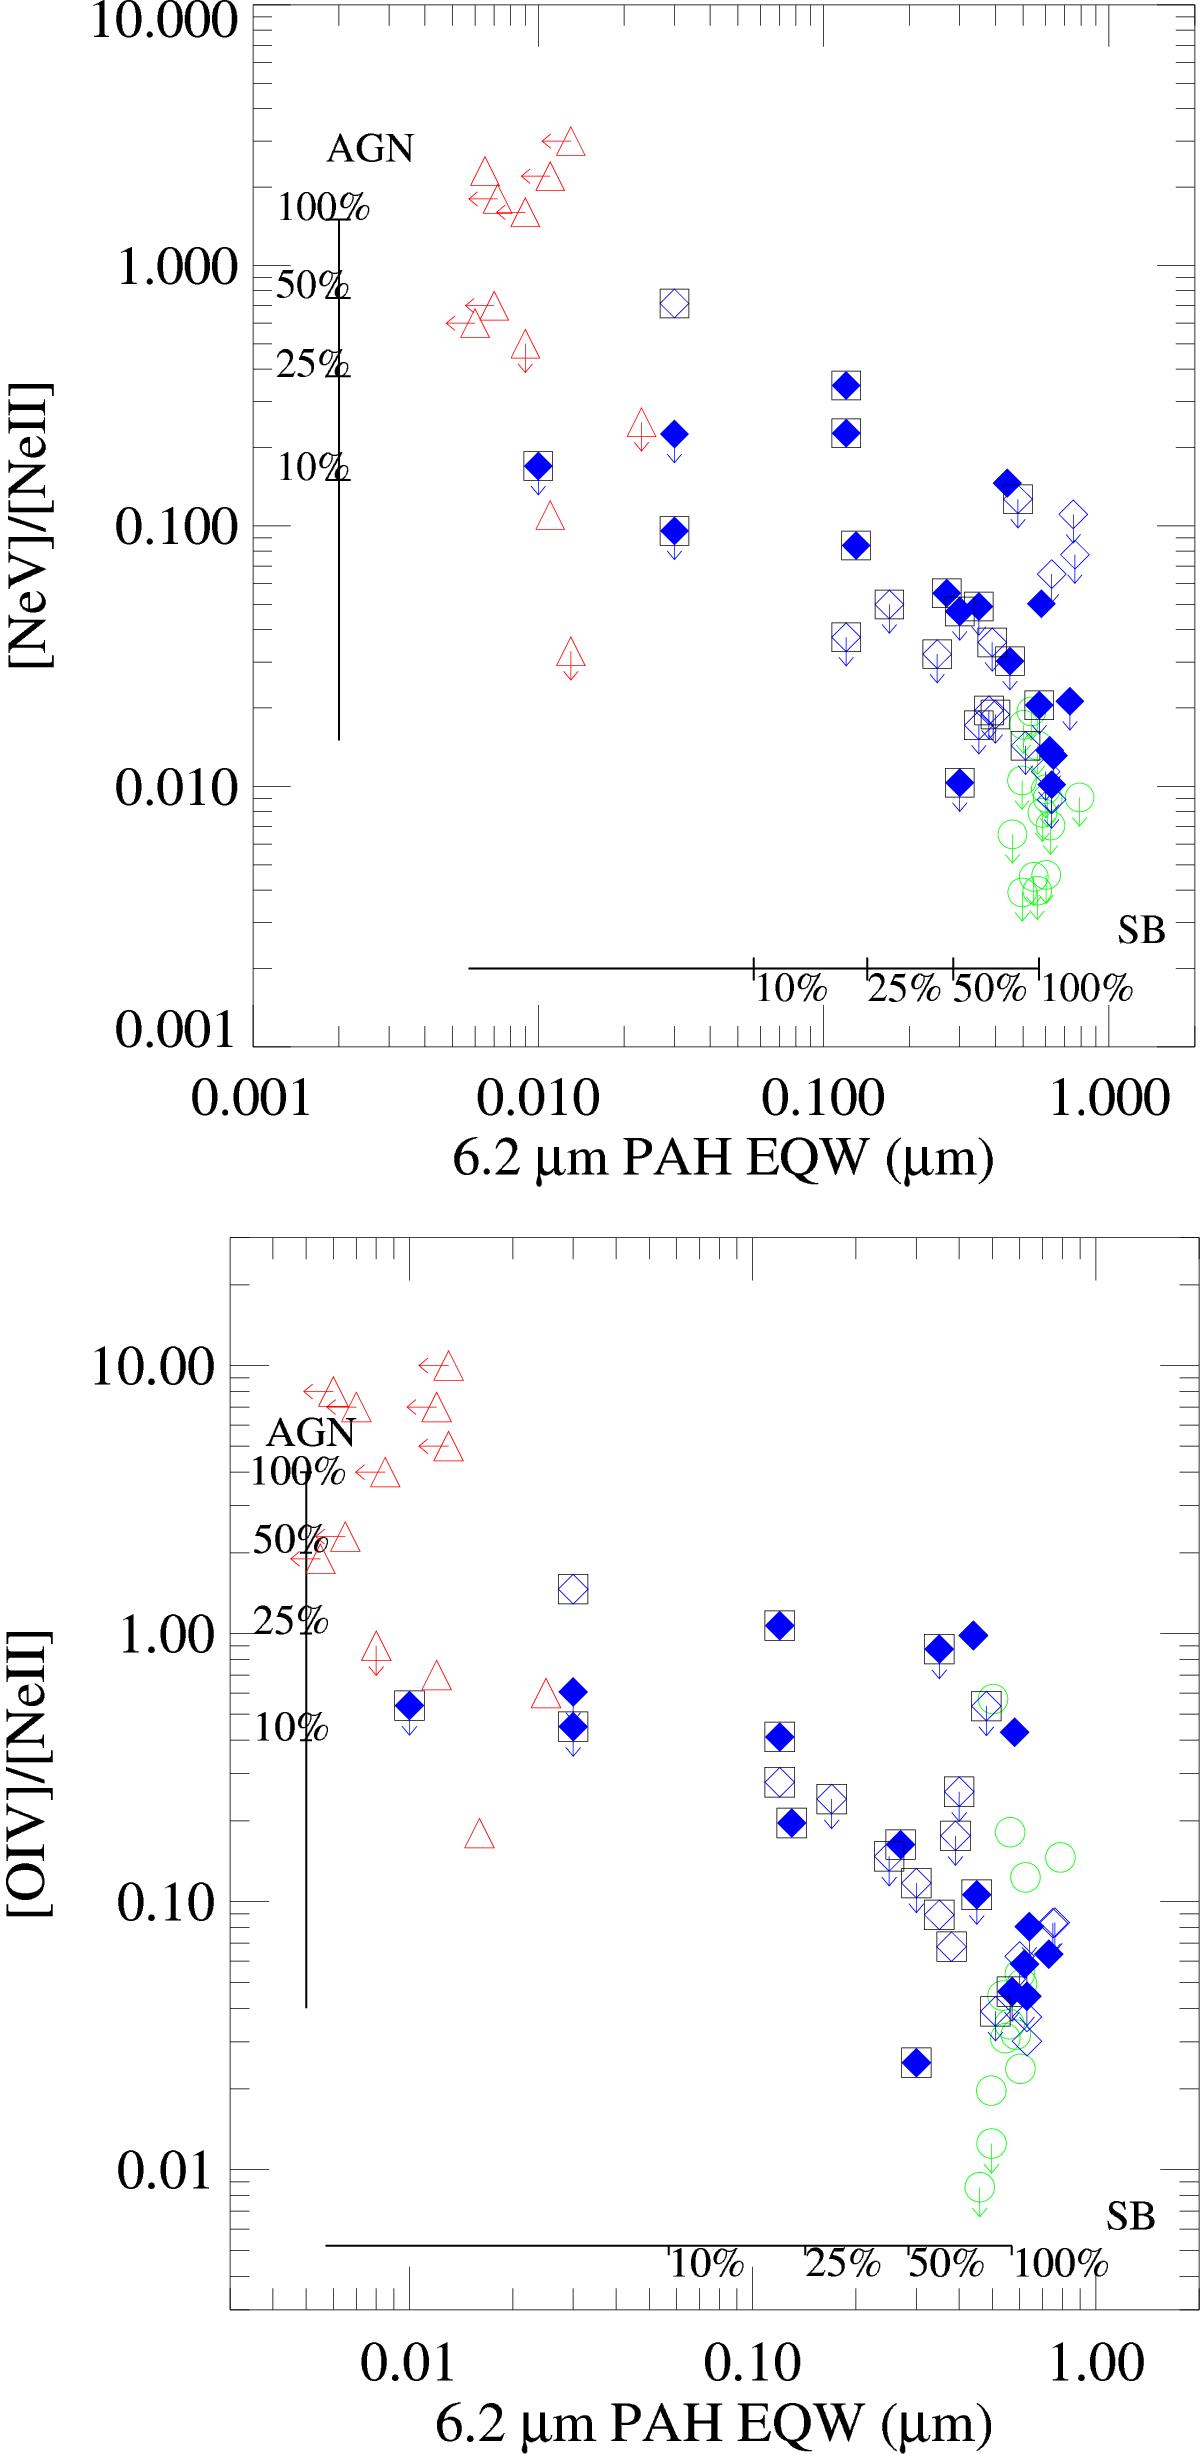
[NeV]/[NeII] (top) and [OIV]/[NeII] (bottom) line ratios (Inami et al. 2013) for the 46 objects in our sample (blue diamonds) versus the equivalent width (EW) of the 6.2 μm PAH feature (EW values from Stierwalt et al. 2013); filled blue diamonds show objects identified as radio-AGN based on our radio diagnostic method, while black squares denote objects with mid-IR fraction above zero (Petric et al. 2011). For comparison we show a sample of AGN (red open triangles) and a sample of SB (including LIRGs; green open circles) taken from Armus et al. (2007). The horizontal line gives the SB contribution, where the 100% is the mean value of the 6.2 μm PAH EW. The vertical line shows the AGN contribution, where as 100% we take the mean value of the [NeV]/[NeII] ratio.
Current usage metrics show cumulative count of Article Views (full-text article views including HTML views, PDF and ePub downloads, according to the available data) and Abstracts Views on Vision4Press platform.
Data correspond to usage on the plateform after 2015. The current usage metrics is available 48-96 hours after online publication and is updated daily on week days.
Initial download of the metrics may take a while.