Fig. 3
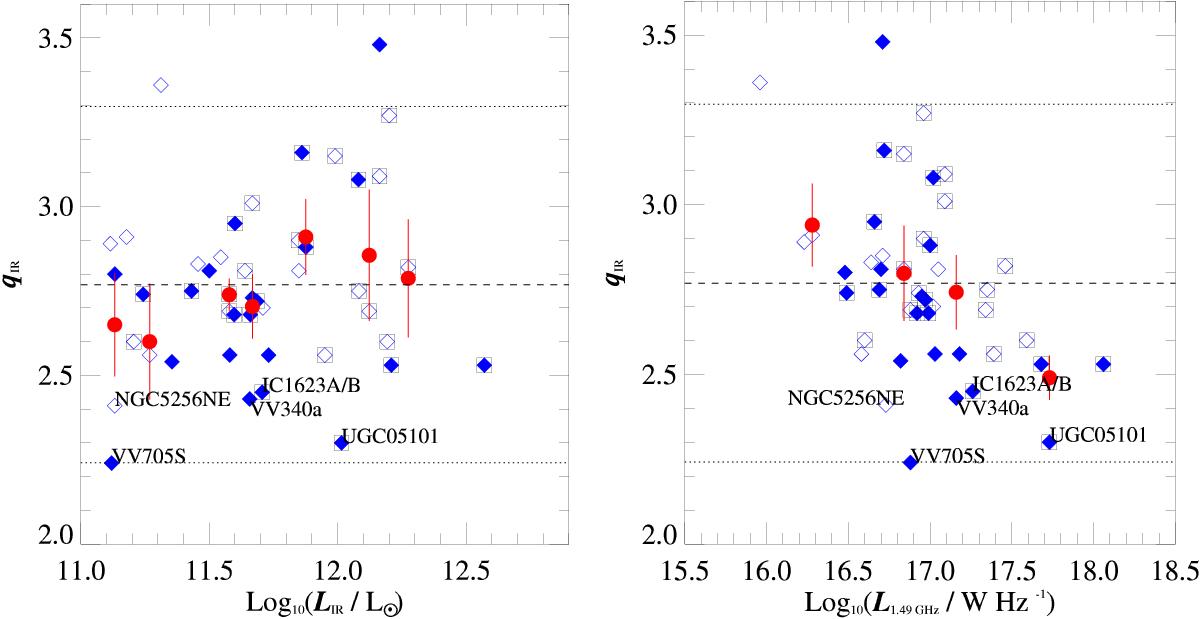
Left: qIR vs. infrared luminosity LIR / 8 − 1000 μm in units of solar luminosity. Right: qIR versus radio luminosity at 1.49 GHz (see Table 1). In both figures, the blue diamonds represent the 46 individual objects in our sample, where objects identified as radio-AGN based on the α-maps are shown as filled blue diamonds (see Table 4). Black squares denote objects with mid-IR fraction above zero (Petric et al. 2011), thus they have a contribution to their mid-IR flux from an AGN. Red filled circles show the mean value of qIR for each luminosity bin and the error bars are the standard deviation; note that the median luminosity is calculated instead of the mean to avoid edge effects due to bin selection. The dashed horizontal line shows the mean qIR for the sample with value of 2.75 ± 0.27; the 2σ error is shown by the horizontal dotted lines. Objects with qIR values below the 1σ error lines are marked with their name.
Current usage metrics show cumulative count of Article Views (full-text article views including HTML views, PDF and ePub downloads, according to the available data) and Abstracts Views on Vision4Press platform.
Data correspond to usage on the plateform after 2015. The current usage metrics is available 48-96 hours after online publication and is updated daily on week days.
Initial download of the metrics may take a while.