Fig. 1
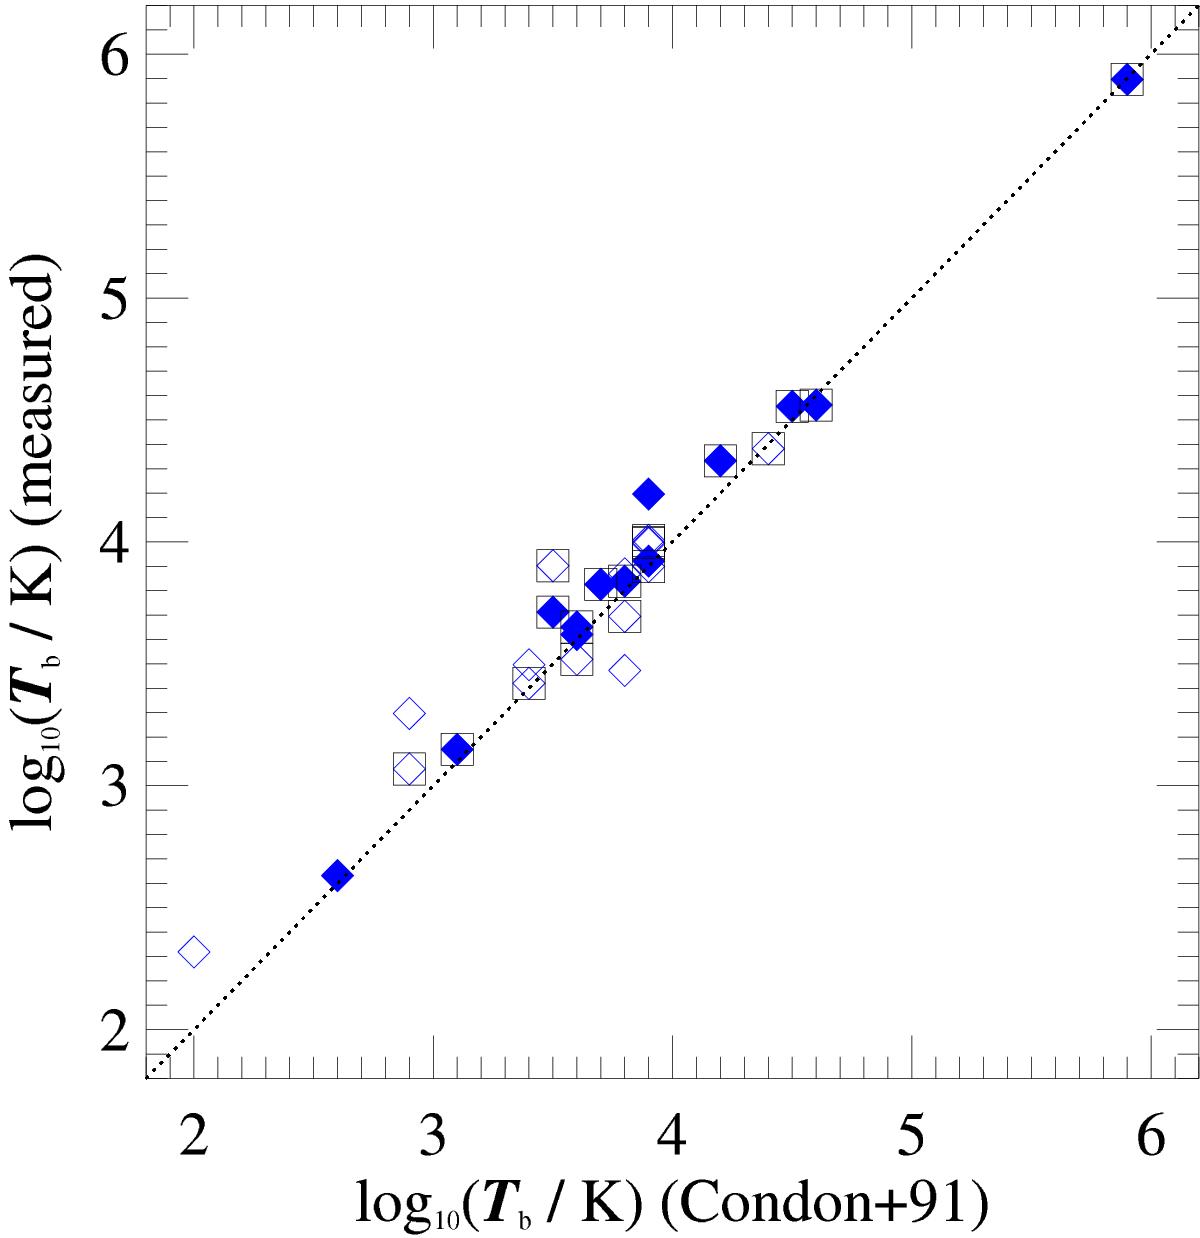
Brightness temperature Tb (in K) as measured from the 8.44 GHz maps, versus brightness temperature from Condon et al. (1991). Not all of our objects have a measurement in Condon et al. (1991), thus are omitted from the plot. Symbols: blue diamonds denote the common objects, filled blue diamonds denote objects classified as radio-AGN (see Table 4), and the black squares denote objects that are classified as mid-IR AGN based on Petric et al. (2011). The dotted line is the one-to-one relation. The relative mean dispersion is 2.5%.
Current usage metrics show cumulative count of Article Views (full-text article views including HTML views, PDF and ePub downloads, according to the available data) and Abstracts Views on Vision4Press platform.
Data correspond to usage on the plateform after 2015. The current usage metrics is available 48-96 hours after online publication and is updated daily on week days.
Initial download of the metrics may take a while.