Fig. 2
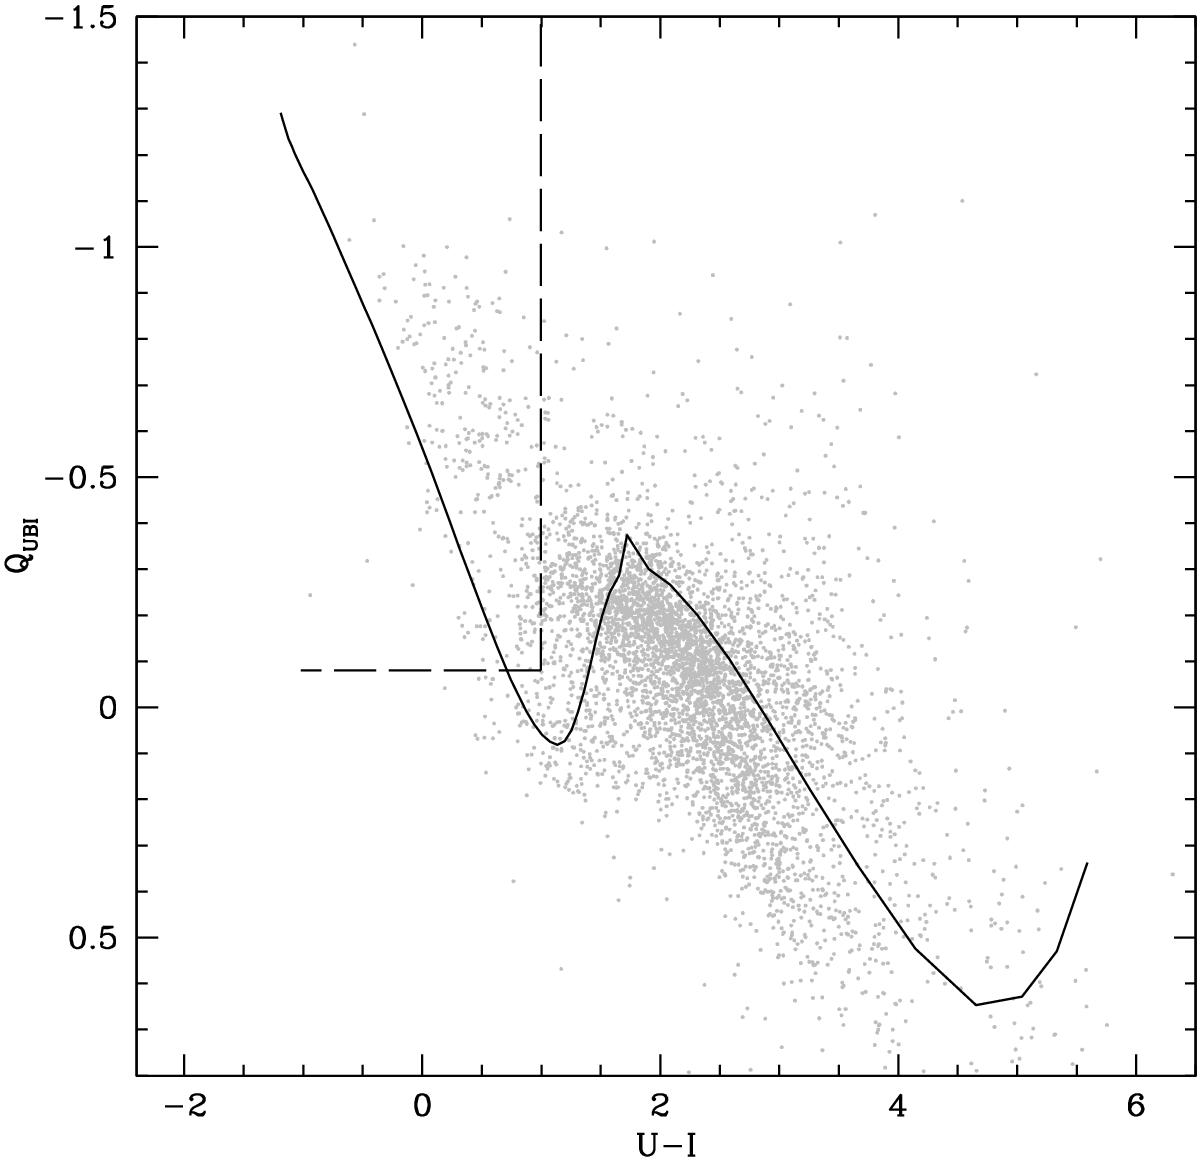
Solid line: reddening free colour QUBI as a function of U − I as derived from the model atmospheres of Bessell et al. (1998) and reddened by the foreground extinction (see details in the text), whereas grey dots: stars in our catalogue. Only stars with U − I< 1 and QUBI< −0.1 (area inside the dashed lines) were used to generate our reddening map.
Current usage metrics show cumulative count of Article Views (full-text article views including HTML views, PDF and ePub downloads, according to the available data) and Abstracts Views on Vision4Press platform.
Data correspond to usage on the plateform after 2015. The current usage metrics is available 48-96 hours after online publication and is updated daily on week days.
Initial download of the metrics may take a while.