Fig. 7
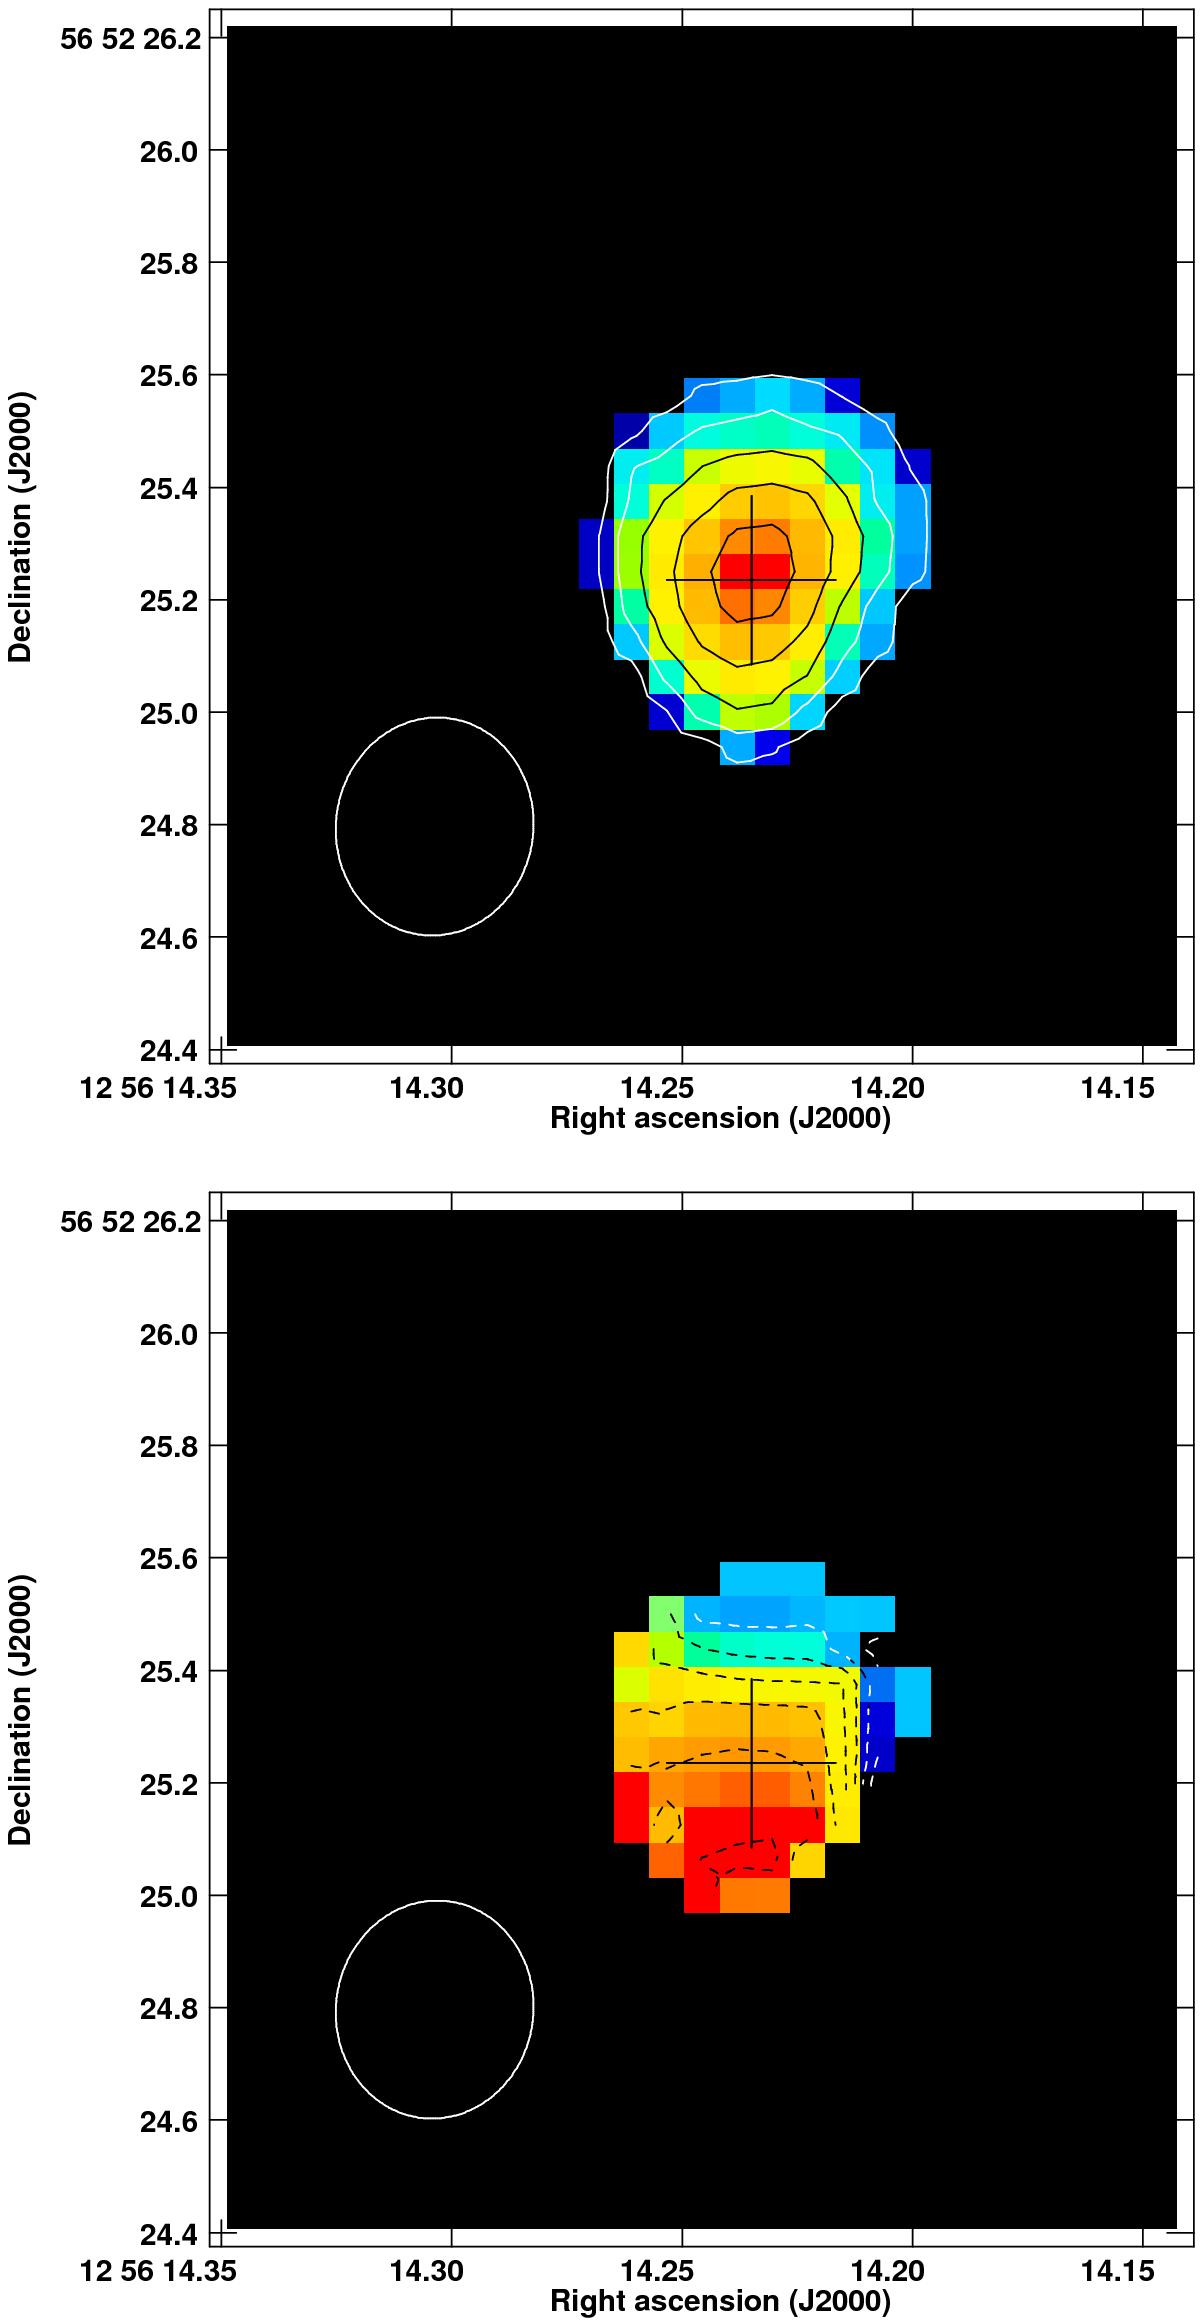
Top panel: integrated intensity of the HCN J = 3−2ν2 = 1f line emission where the contour levels are 0.14 × (1,3,5,7,9) Jy beam-1 km s-1. The peak flux is 1.5 Jy beam-1 km s-1 and the cross marks the position of the peak HCN 3–2 integrated intensity. Lower panel: velocity field with contour levels starting at − 60 km s-1 and then increasing by steps of 15 km s-1 until +30 km s-1. The grey (colour) scale ranges from − 60 to 40 km s-1. (In the online version of this figure the greyscale is replaced with a rainbow color scale ranging from dark blue to red.)
Current usage metrics show cumulative count of Article Views (full-text article views including HTML views, PDF and ePub downloads, according to the available data) and Abstracts Views on Vision4Press platform.
Data correspond to usage on the plateform after 2015. The current usage metrics is available 48-96 hours after online publication and is updated daily on week days.
Initial download of the metrics may take a while.