Fig. 6
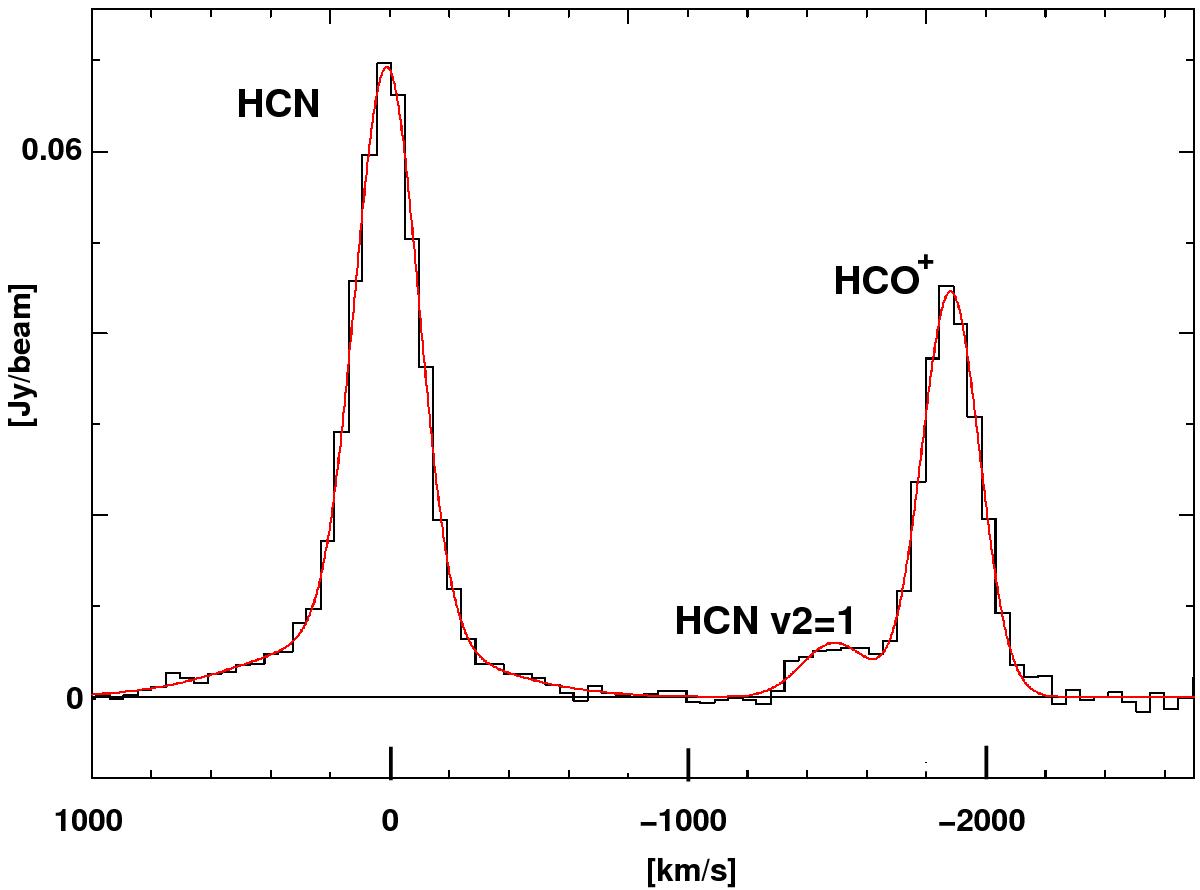
Gaussian fits to the A+B combined data central spectrum. Fits are peak flux and line width: HCN ν = 0 line centre (63 mJy/beam, 250 km s-1), line wings (7 mJy/beam, 840 km s-1); HCN ν2 = 1f (6 mJy/beam, 260 km s-1); HCO+ (45 mJy/beam, 227 km s-1). Since the A- and B-array data had a slight shift in centre frequency the edges of the band have been cut, leaving out the HOC+ detection at the blue end of the spectrum.
Current usage metrics show cumulative count of Article Views (full-text article views including HTML views, PDF and ePub downloads, according to the available data) and Abstracts Views on Vision4Press platform.
Data correspond to usage on the plateform after 2015. The current usage metrics is available 48-96 hours after online publication and is updated daily on week days.
Initial download of the metrics may take a while.