Free Access
Fig. 4
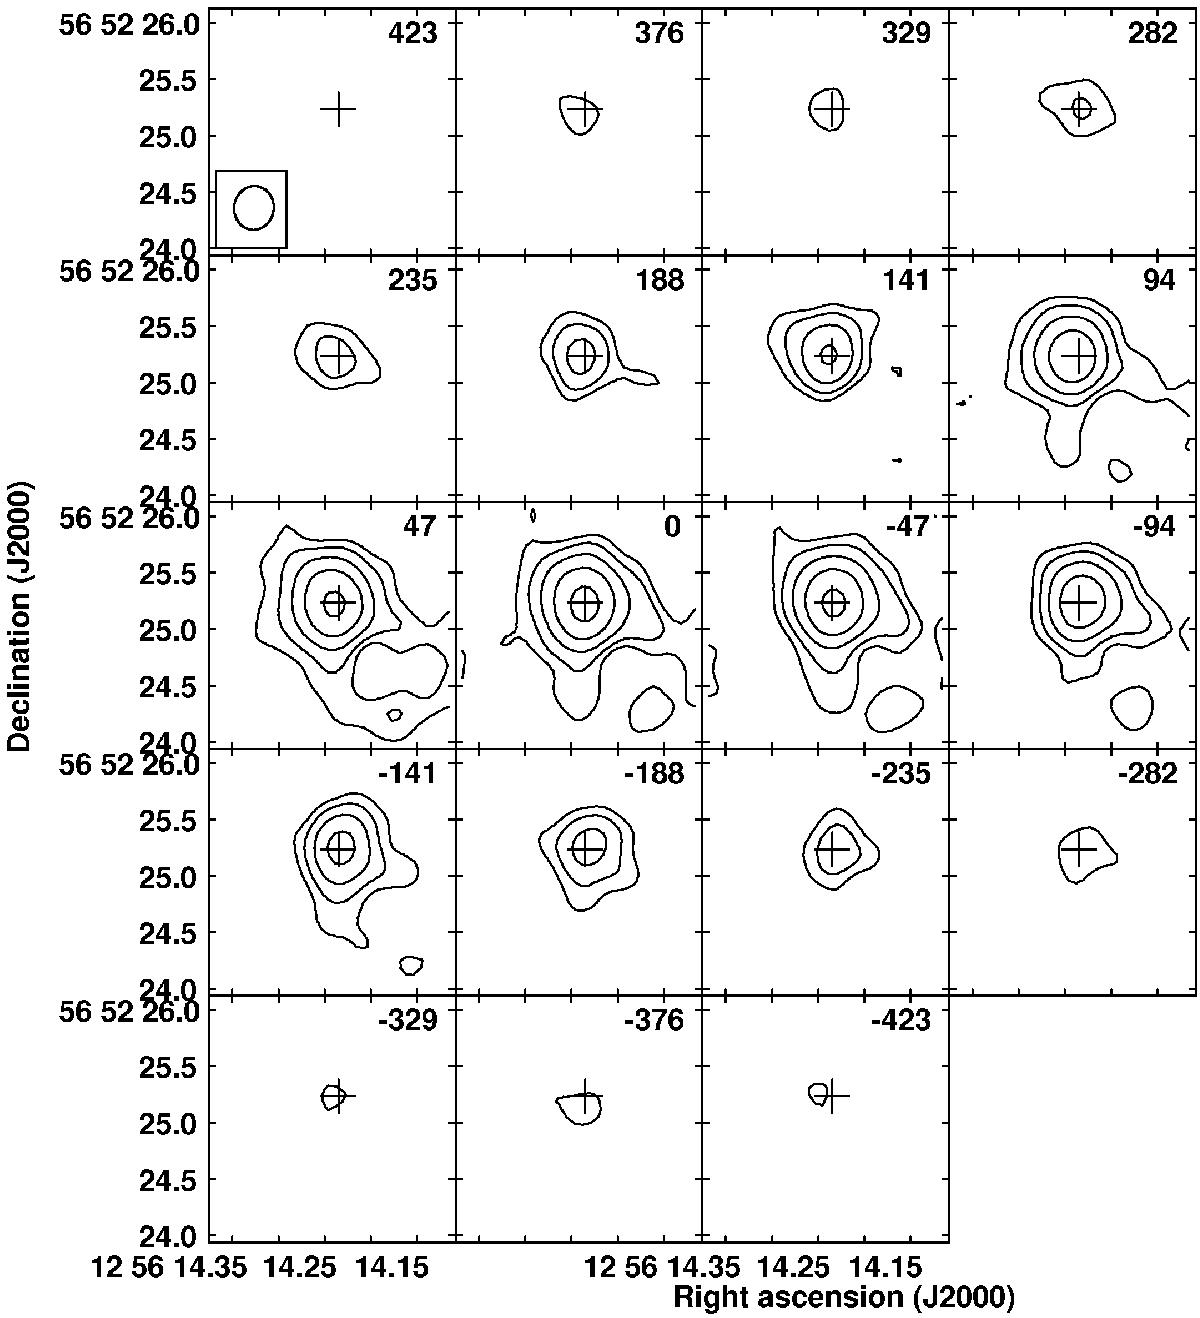
Channel map of the HCN 3−2 emission towards Mrk 231, as obtained from the combination of the A and B configuration data. Contours are logarithmic: 3.6 × (1, 2, 4, 8, 16) mJy beam-1 where the first contour is at 4.5σ. The synthesized beam of ![]() is shown in the upper left panel.
is shown in the upper left panel.
Current usage metrics show cumulative count of Article Views (full-text article views including HTML views, PDF and ePub downloads, according to the available data) and Abstracts Views on Vision4Press platform.
Data correspond to usage on the plateform after 2015. The current usage metrics is available 48-96 hours after online publication and is updated daily on week days.
Initial download of the metrics may take a while.