Fig. 3
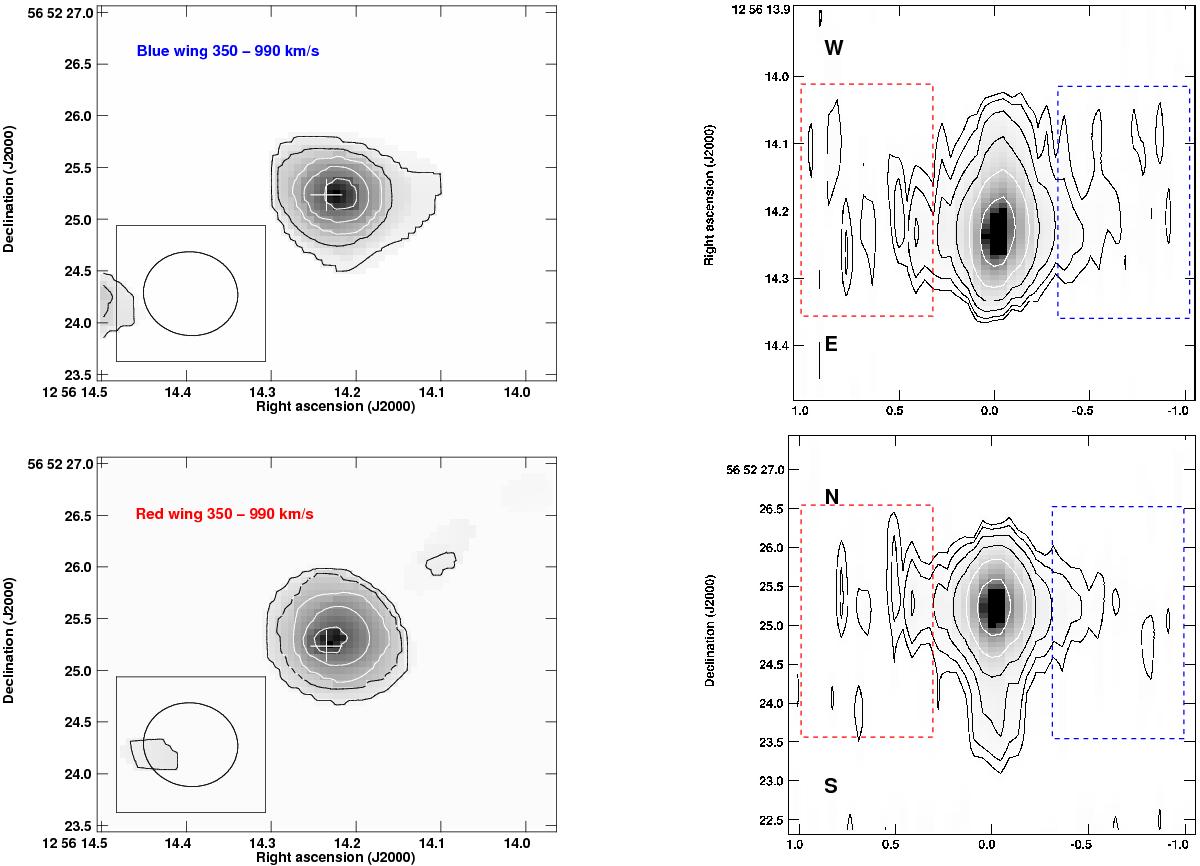
Left: moment 0 maps (integrated intensity) of the HCN 3−2 line wings in tapered B array. Contour levels are 0.2 × (1,3,5,7,9) Jy beam-1 km s-1 and greyscale ranges from 0 to 2 Jy beam-1 km s-1. The cross marks the position of the peak HCN 3−2 integrated intensity. Right: pV diagrams of the tapered B array map. Upper: east-west cut along the line of nodes of the main disk rotation. Lower: north-south cut along the minor axis of the main disk rotation. Greyscale ranges from 0 to 120 mJy beam-1, contours are 3 × (1, 2, 4, 8, 16, 32) mJy beam-1. First contour is 2σ.
Current usage metrics show cumulative count of Article Views (full-text article views including HTML views, PDF and ePub downloads, according to the available data) and Abstracts Views on Vision4Press platform.
Data correspond to usage on the plateform after 2015. The current usage metrics is available 48-96 hours after online publication and is updated daily on week days.
Initial download of the metrics may take a while.