Fig. 1
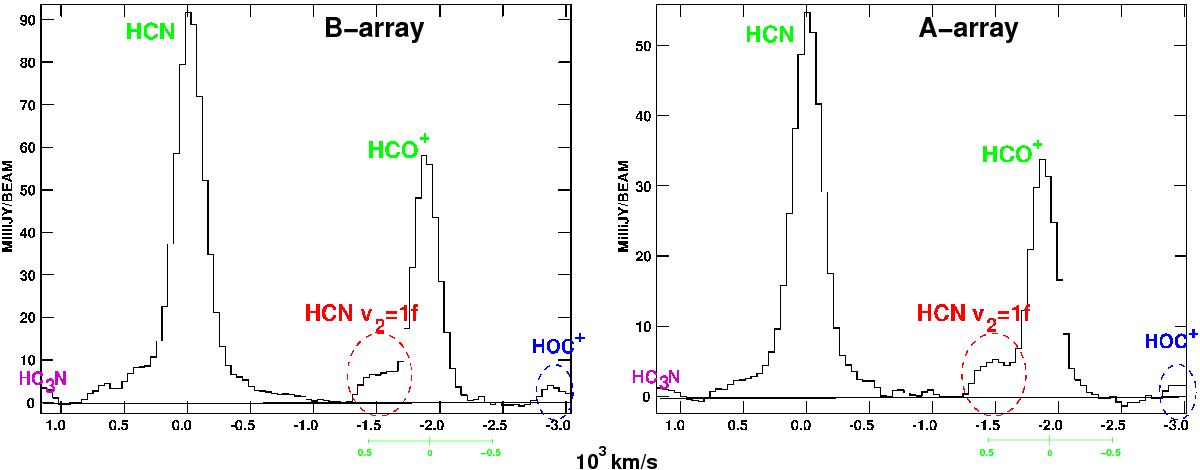
Separate A- and B-array spectra towards the central beam. Spectra have been Gaussian smoothed (over two channels). We show the spectra for the A- and B-array separately to emphasize that identified features appear in both separate datasets. The central spectrum for the combined A+B dataset is shown in Fig. 6. Left: B-array spectrum of HCN J = 3−2, HCO+J = 3−2, HCN J = 3−2ν2 = 1, and a tentative detection of HOC+J = 3−2. Right: a-array spectrum of the same lines. The green velocity scale is for HCO+.
Current usage metrics show cumulative count of Article Views (full-text article views including HTML views, PDF and ePub downloads, according to the available data) and Abstracts Views on Vision4Press platform.
Data correspond to usage on the plateform after 2015. The current usage metrics is available 48-96 hours after online publication and is updated daily on week days.
Initial download of the metrics may take a while.