Fig. 9
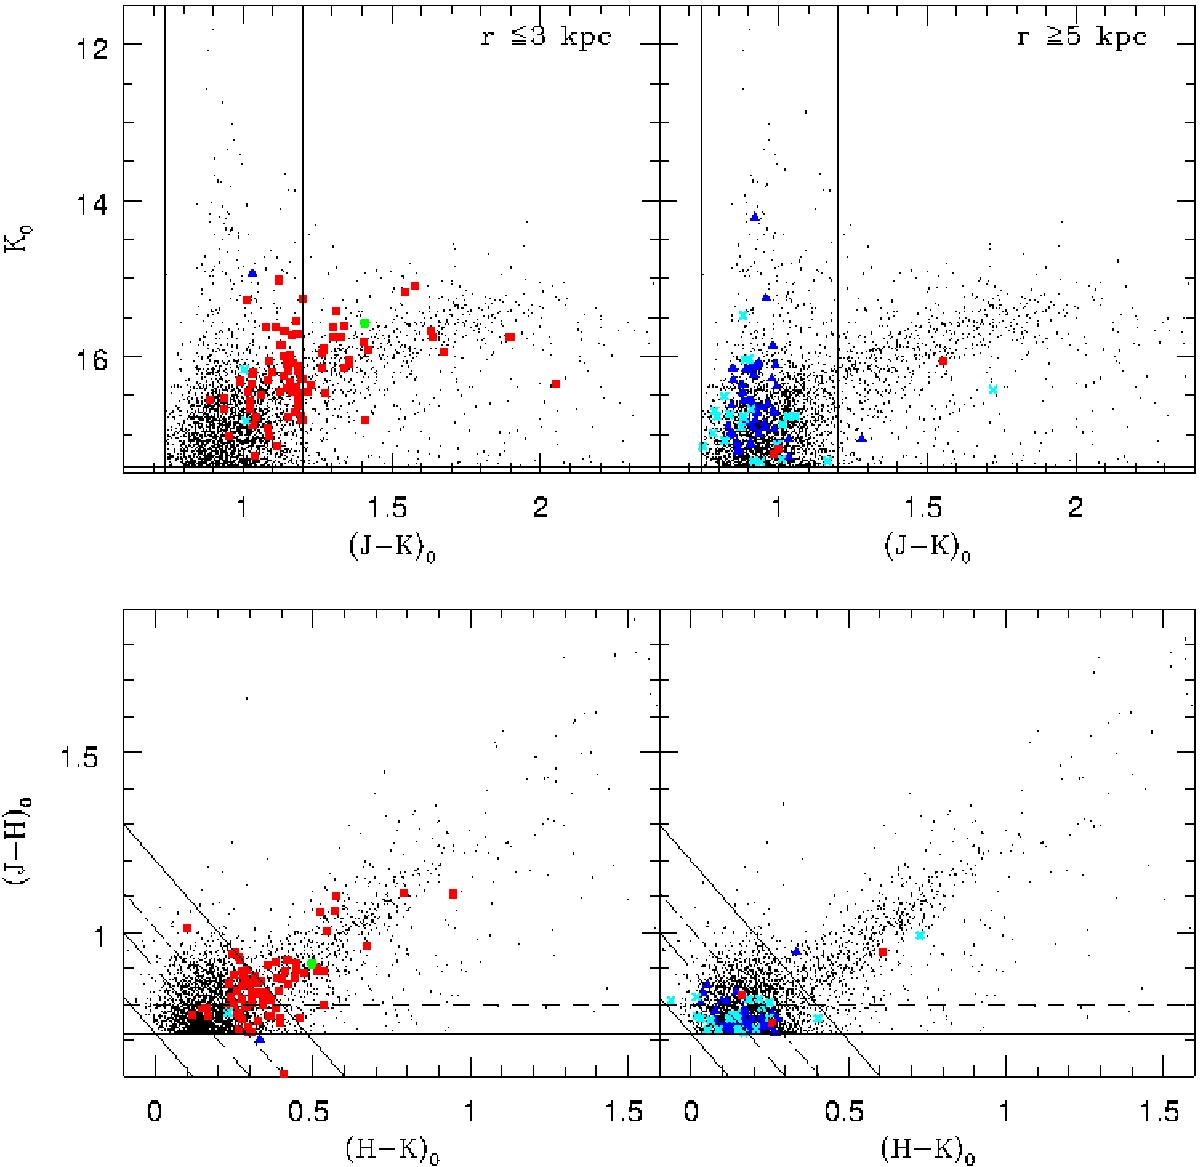
Top: CMDs of all the spectroscopically identified sources (S/N ≥ 10) overlayed on the AGB candidate sources classified in Paper I. On the left are sources from the inner region (≤3 kpc) and on the right are sources from the outer region (≥5 kpc). The symbols used are the same as in Fig. 5. The solid horizontal and vertical lines mark the selection criteria used in Paper I. Bottom: colour–colour diagrams of the same sources. The solid diagonal and horizontal lines mark the selection criteria used in Paper I. The dashed horizontal line marks an alternate colour criterion at (J − H)0 = 0.80 mag discussed in the text. The long dash diagonal line and the dash-dot diagonal line represent the blue limits used by Kacharov et al. (2012) and Bessell & Brett (1988) respectively to try to eliminate foreground sources.
Current usage metrics show cumulative count of Article Views (full-text article views including HTML views, PDF and ePub downloads, according to the available data) and Abstracts Views on Vision4Press platform.
Data correspond to usage on the plateform after 2015. The current usage metrics is available 48-96 hours after online publication and is updated daily on week days.
Initial download of the metrics may take a while.