Fig. 7
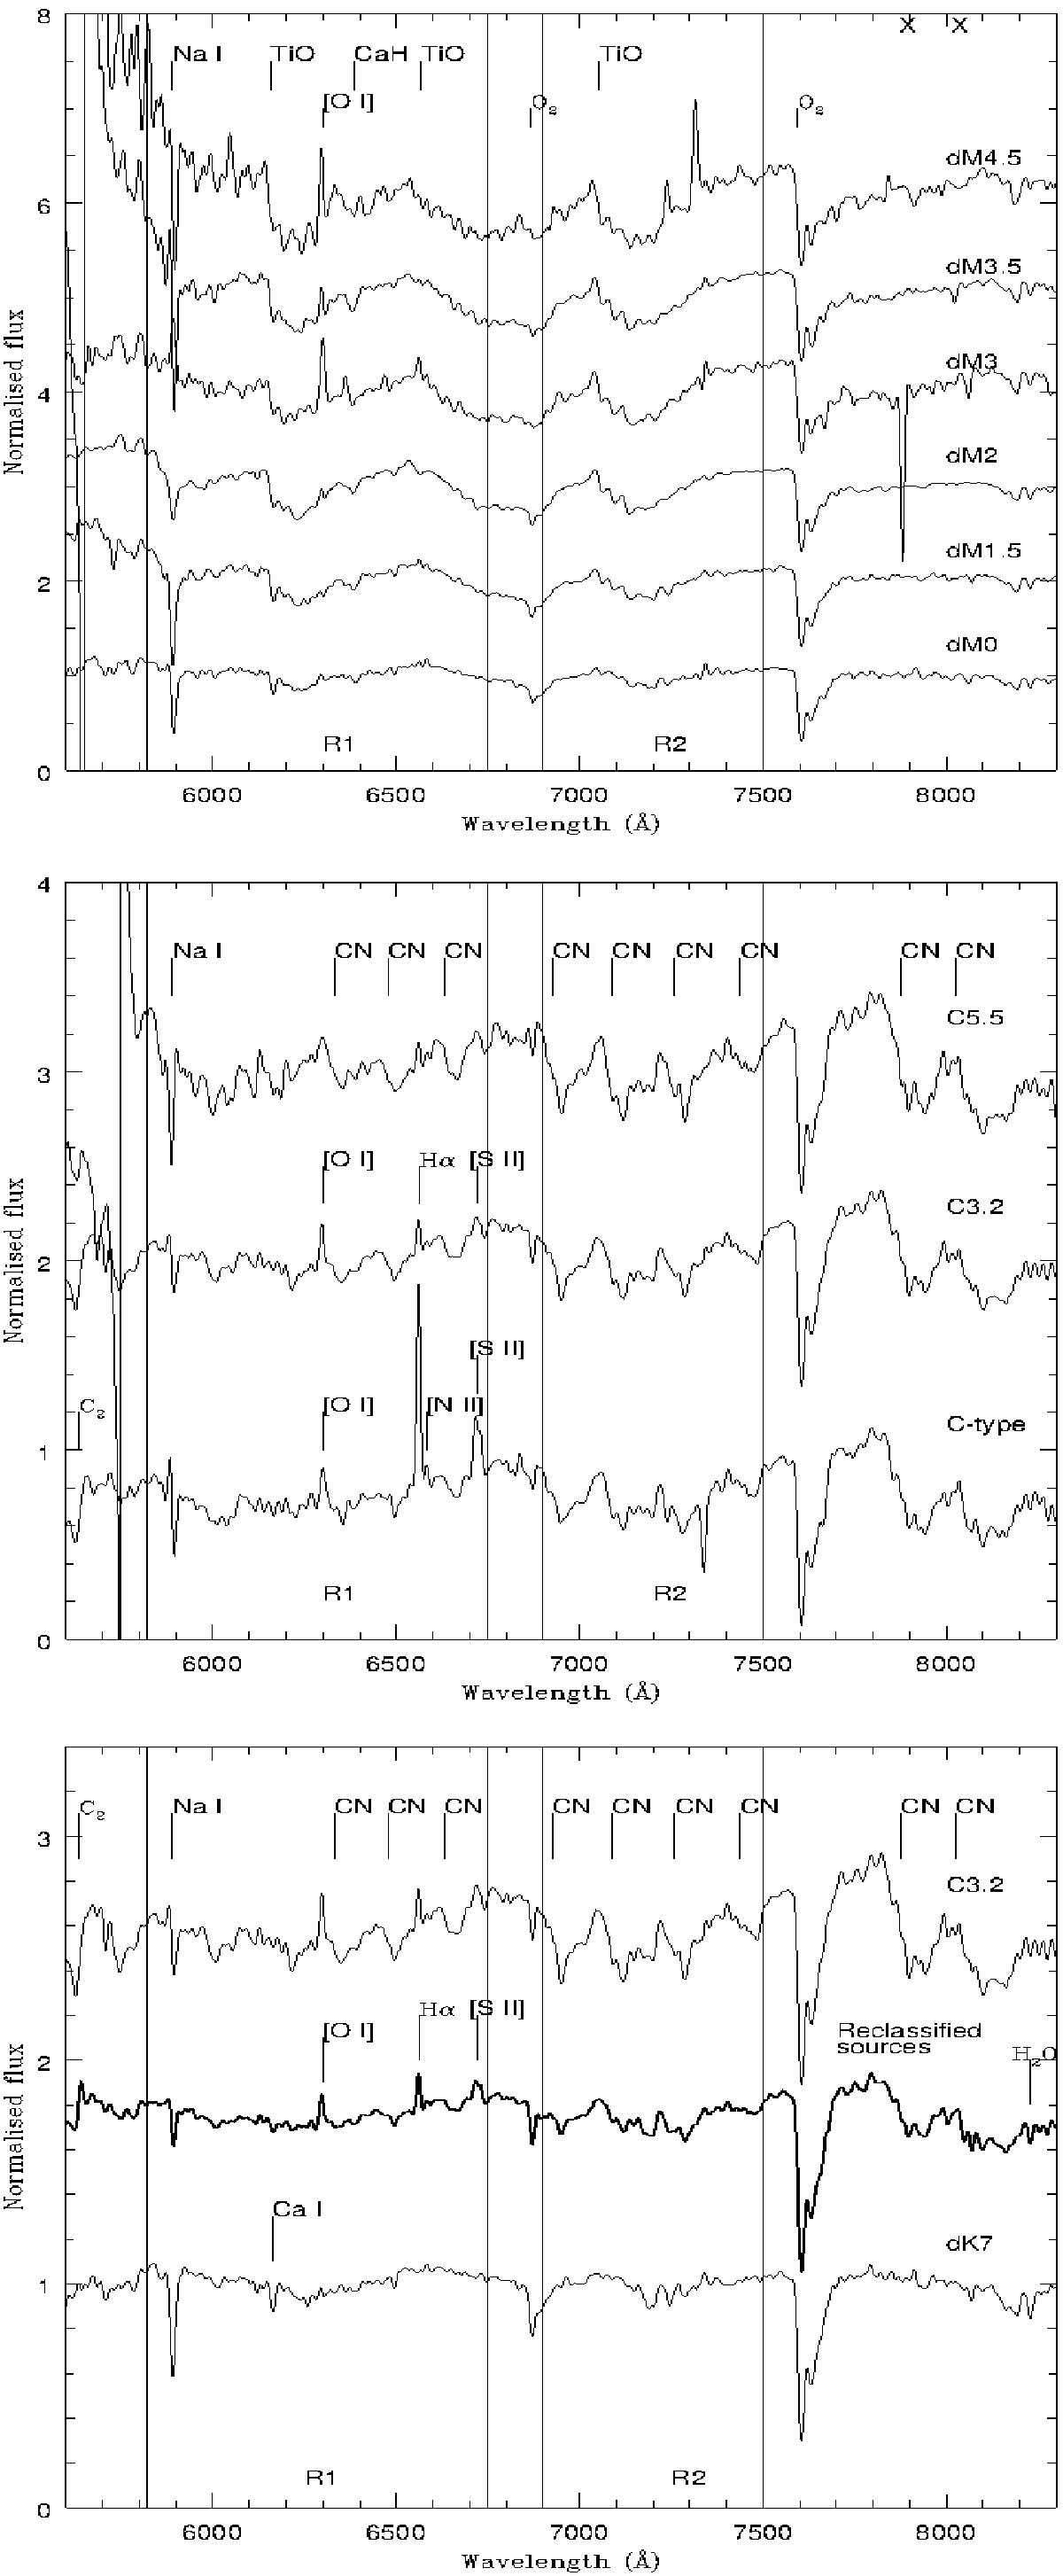
Top: average spectra of the different subclasses of M-type dwarf identified in our spectral sample. Middle: average spectra of the most common types of C-type giants identified in our sample. Bottom: average spectrum of the genuine dK7 sources in our sample and the average spectrum of those sources classified as K-type dwarf stars by the matching program but which were reclassified as early C-type stars (bold line) following a visual inspection. The C3.2 average spectrum is plotted again for comparison.
Current usage metrics show cumulative count of Article Views (full-text article views including HTML views, PDF and ePub downloads, according to the available data) and Abstracts Views on Vision4Press platform.
Data correspond to usage on the plateform after 2015. The current usage metrics is available 48-96 hours after online publication and is updated daily on week days.
Initial download of the metrics may take a while.