Fig. 6
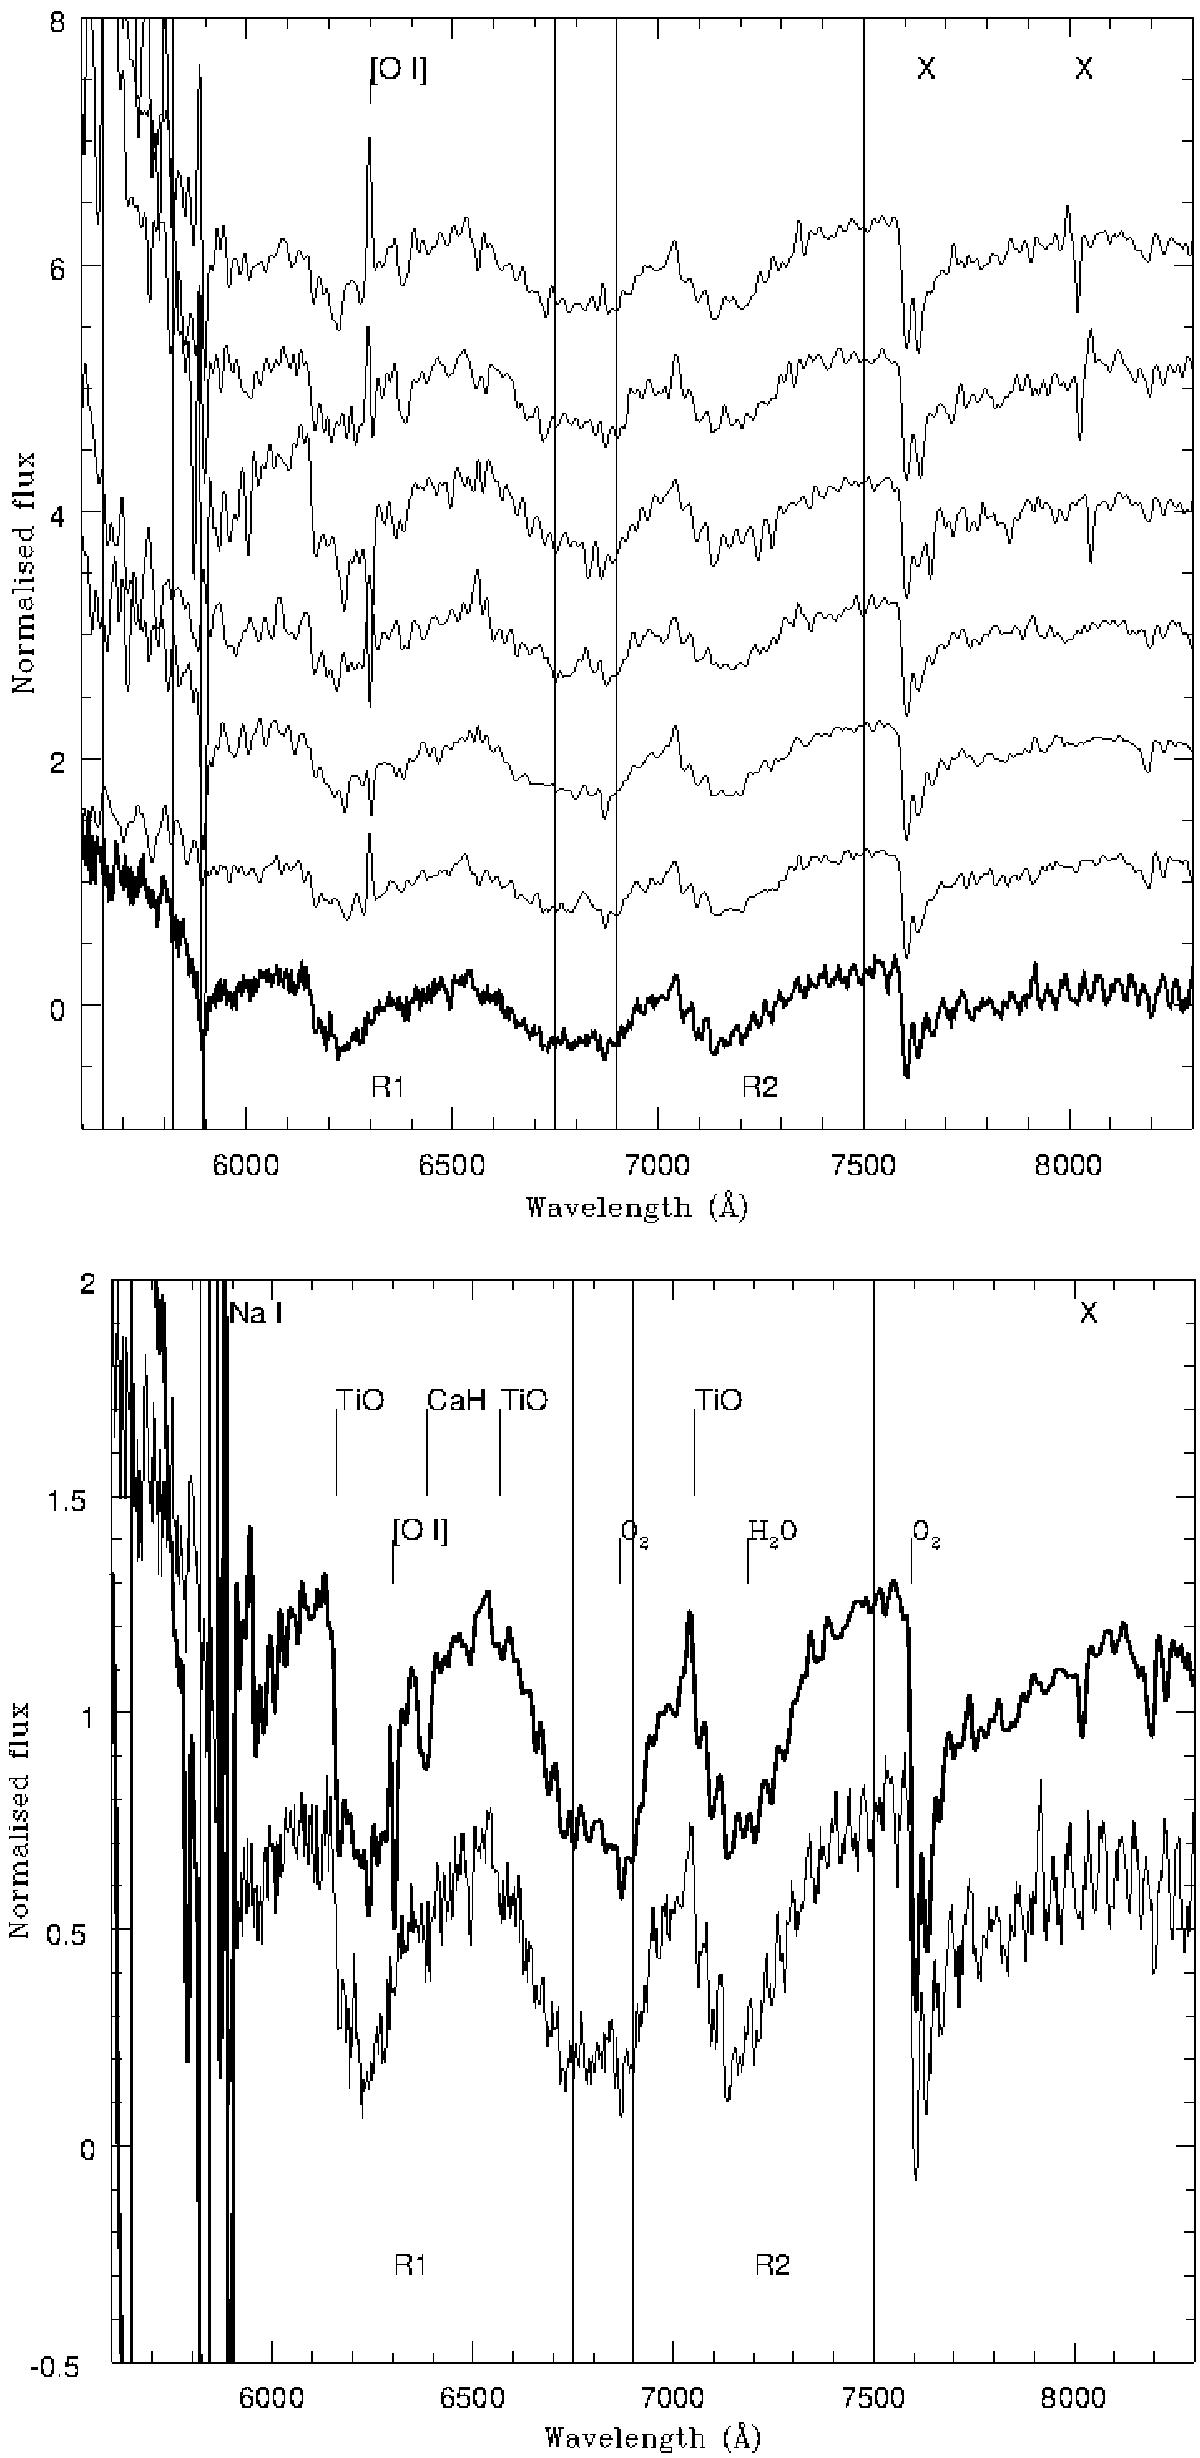
Top: six of the seven spectra classified as dM3.5 by the automated matching program are presented with a dM3.5 standard spectrum from Kacharov et al. (2012) (thick black line). The seventh source (ID: 128222) classified as dM3.5 was excluded because of excessive noise in the blue which obscured the plot. Bottom: the average (thick solid line) of all seven spectra classified as dM3.5 including source ID:128222, and the same dM3.5 spectrum from Kacharov et al. (2012) (thin solid line). Our spectra have been smoothed to the same resolution as the Kacharov et al. (2012) data (in both panels) for comparison purposes.
Current usage metrics show cumulative count of Article Views (full-text article views including HTML views, PDF and ePub downloads, according to the available data) and Abstracts Views on Vision4Press platform.
Data correspond to usage on the plateform after 2015. The current usage metrics is available 48-96 hours after online publication and is updated daily on week days.
Initial download of the metrics may take a while.