Fig. 4
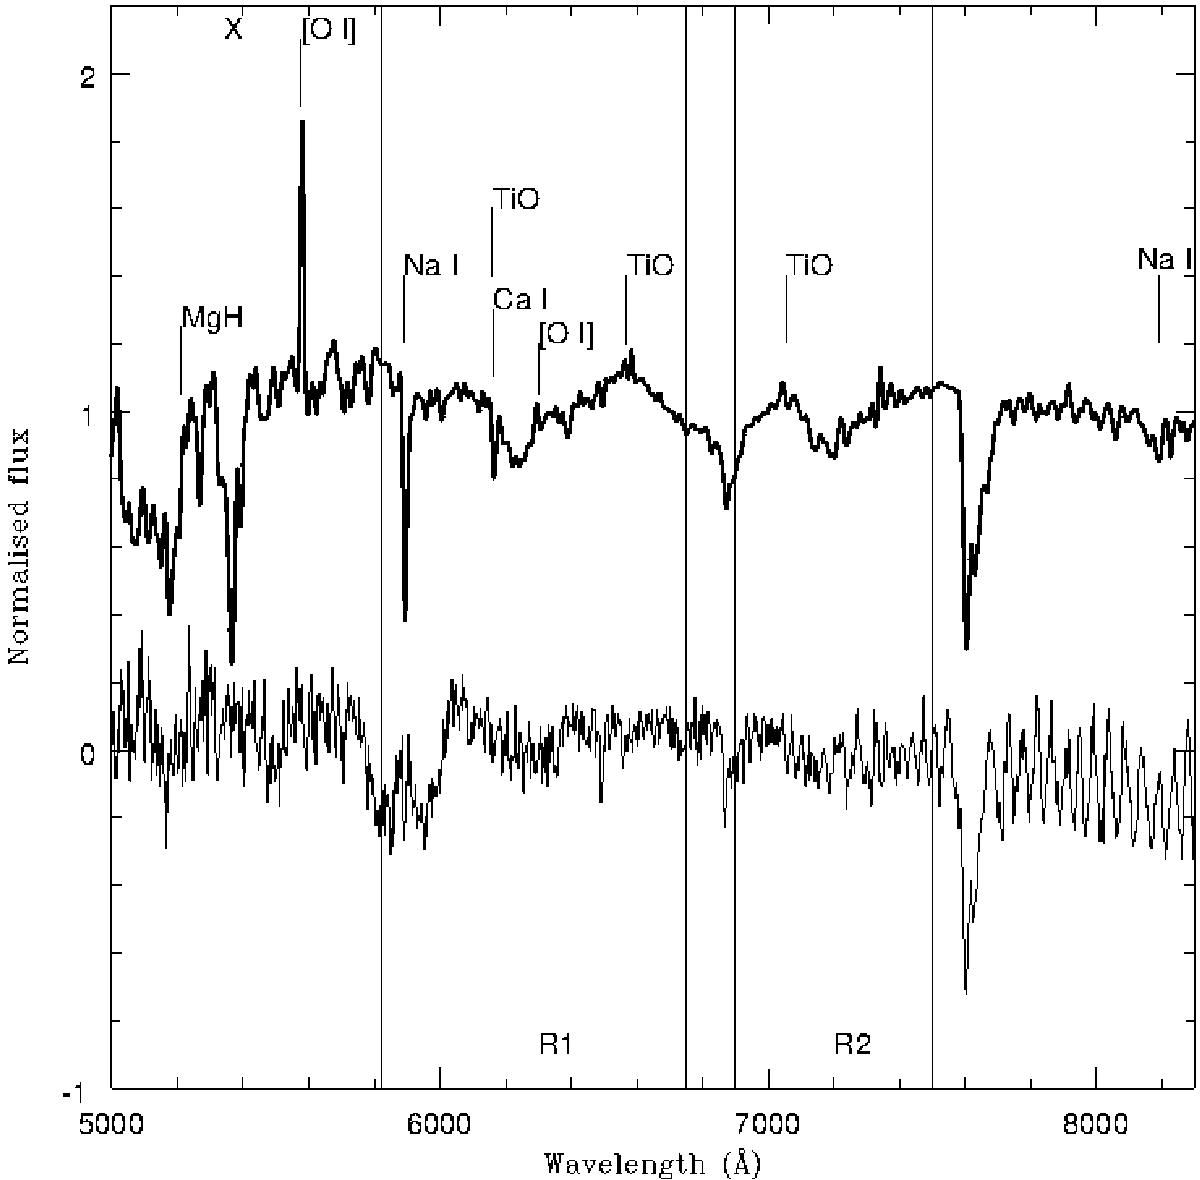
Average spectrum (see Sect. 3.1.4) for the sources classified as dM0 is shown (top). The molecular bandheads and line features used to identify the dwarf sources in our spectroscopic sample are marked. For comparison we show (bottom) the spectrum of a M0 III star from Kacharov et al. (2012). R1 and R2 refer to classification regions 1 and 2.
Current usage metrics show cumulative count of Article Views (full-text article views including HTML views, PDF and ePub downloads, according to the available data) and Abstracts Views on Vision4Press platform.
Data correspond to usage on the plateform after 2015. The current usage metrics is available 48-96 hours after online publication and is updated daily on week days.
Initial download of the metrics may take a while.