Fig. 3
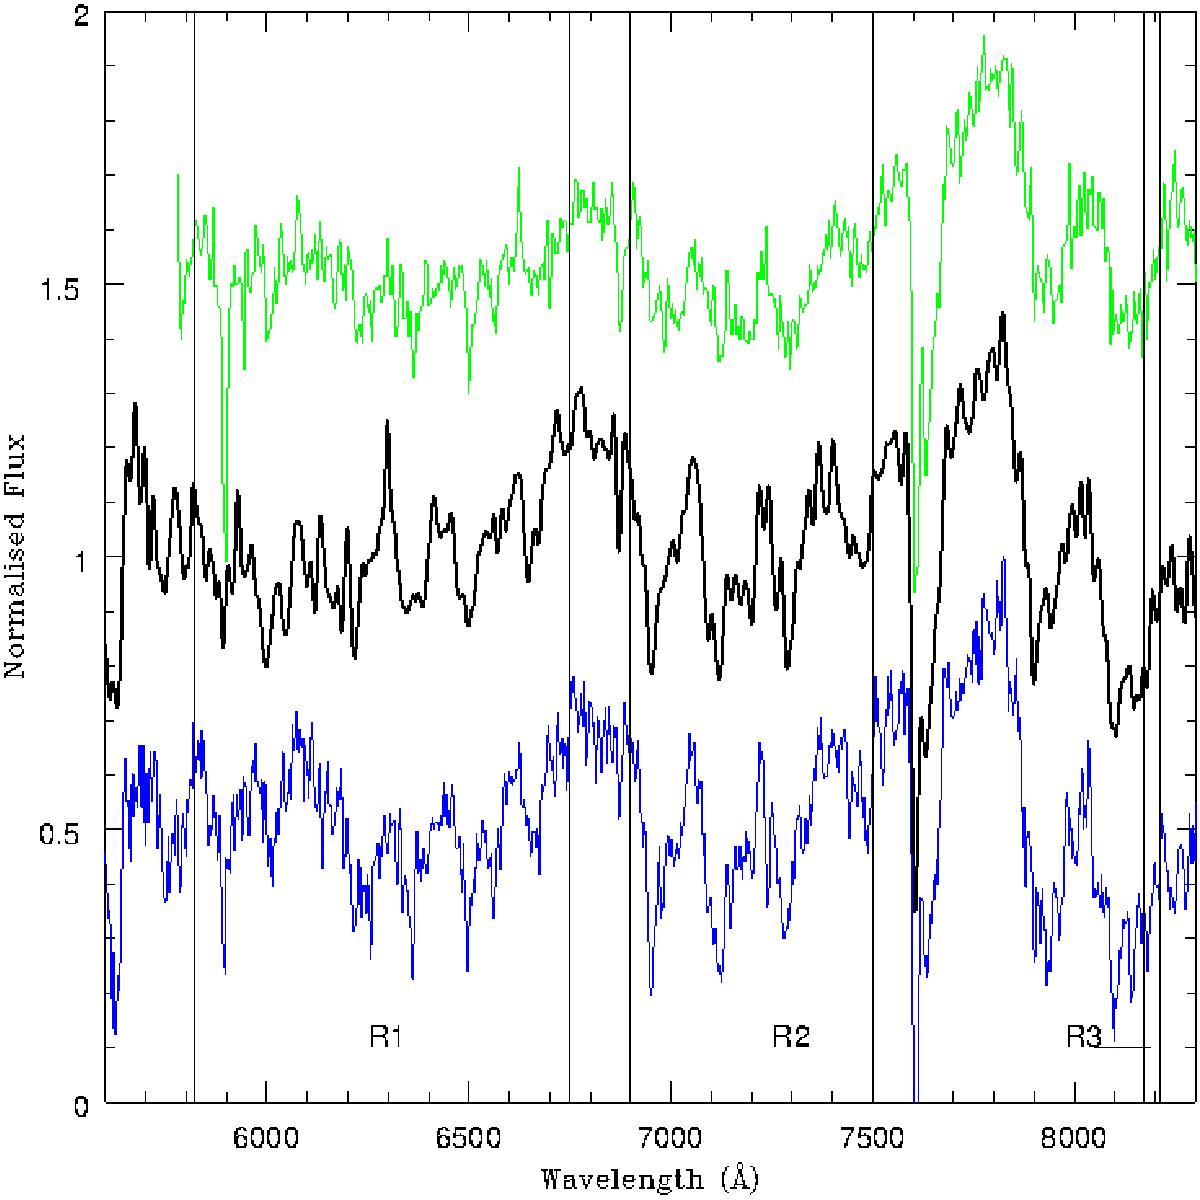
Three spectra that have been normalised and had their slopes realigned for comparison. In the middle is the spectrum for one of our sources, ID: 211898 (black line). Top is the spectrum from Danks & Dennefeld (1994) (green line) and bottom is the spectrum from Kacharov et al. (2012) (blue line) that were selected as being the best match for our spectrum by the χ2 matching program – both are C-type stars. The vertical lines mark the boundaries of regions 1, 2 and 3 as discussed in the text (Sect. 3.1.1).
Current usage metrics show cumulative count of Article Views (full-text article views including HTML views, PDF and ePub downloads, according to the available data) and Abstracts Views on Vision4Press platform.
Data correspond to usage on the plateform after 2015. The current usage metrics is available 48-96 hours after online publication and is updated daily on week days.
Initial download of the metrics may take a while.