Fig. 2
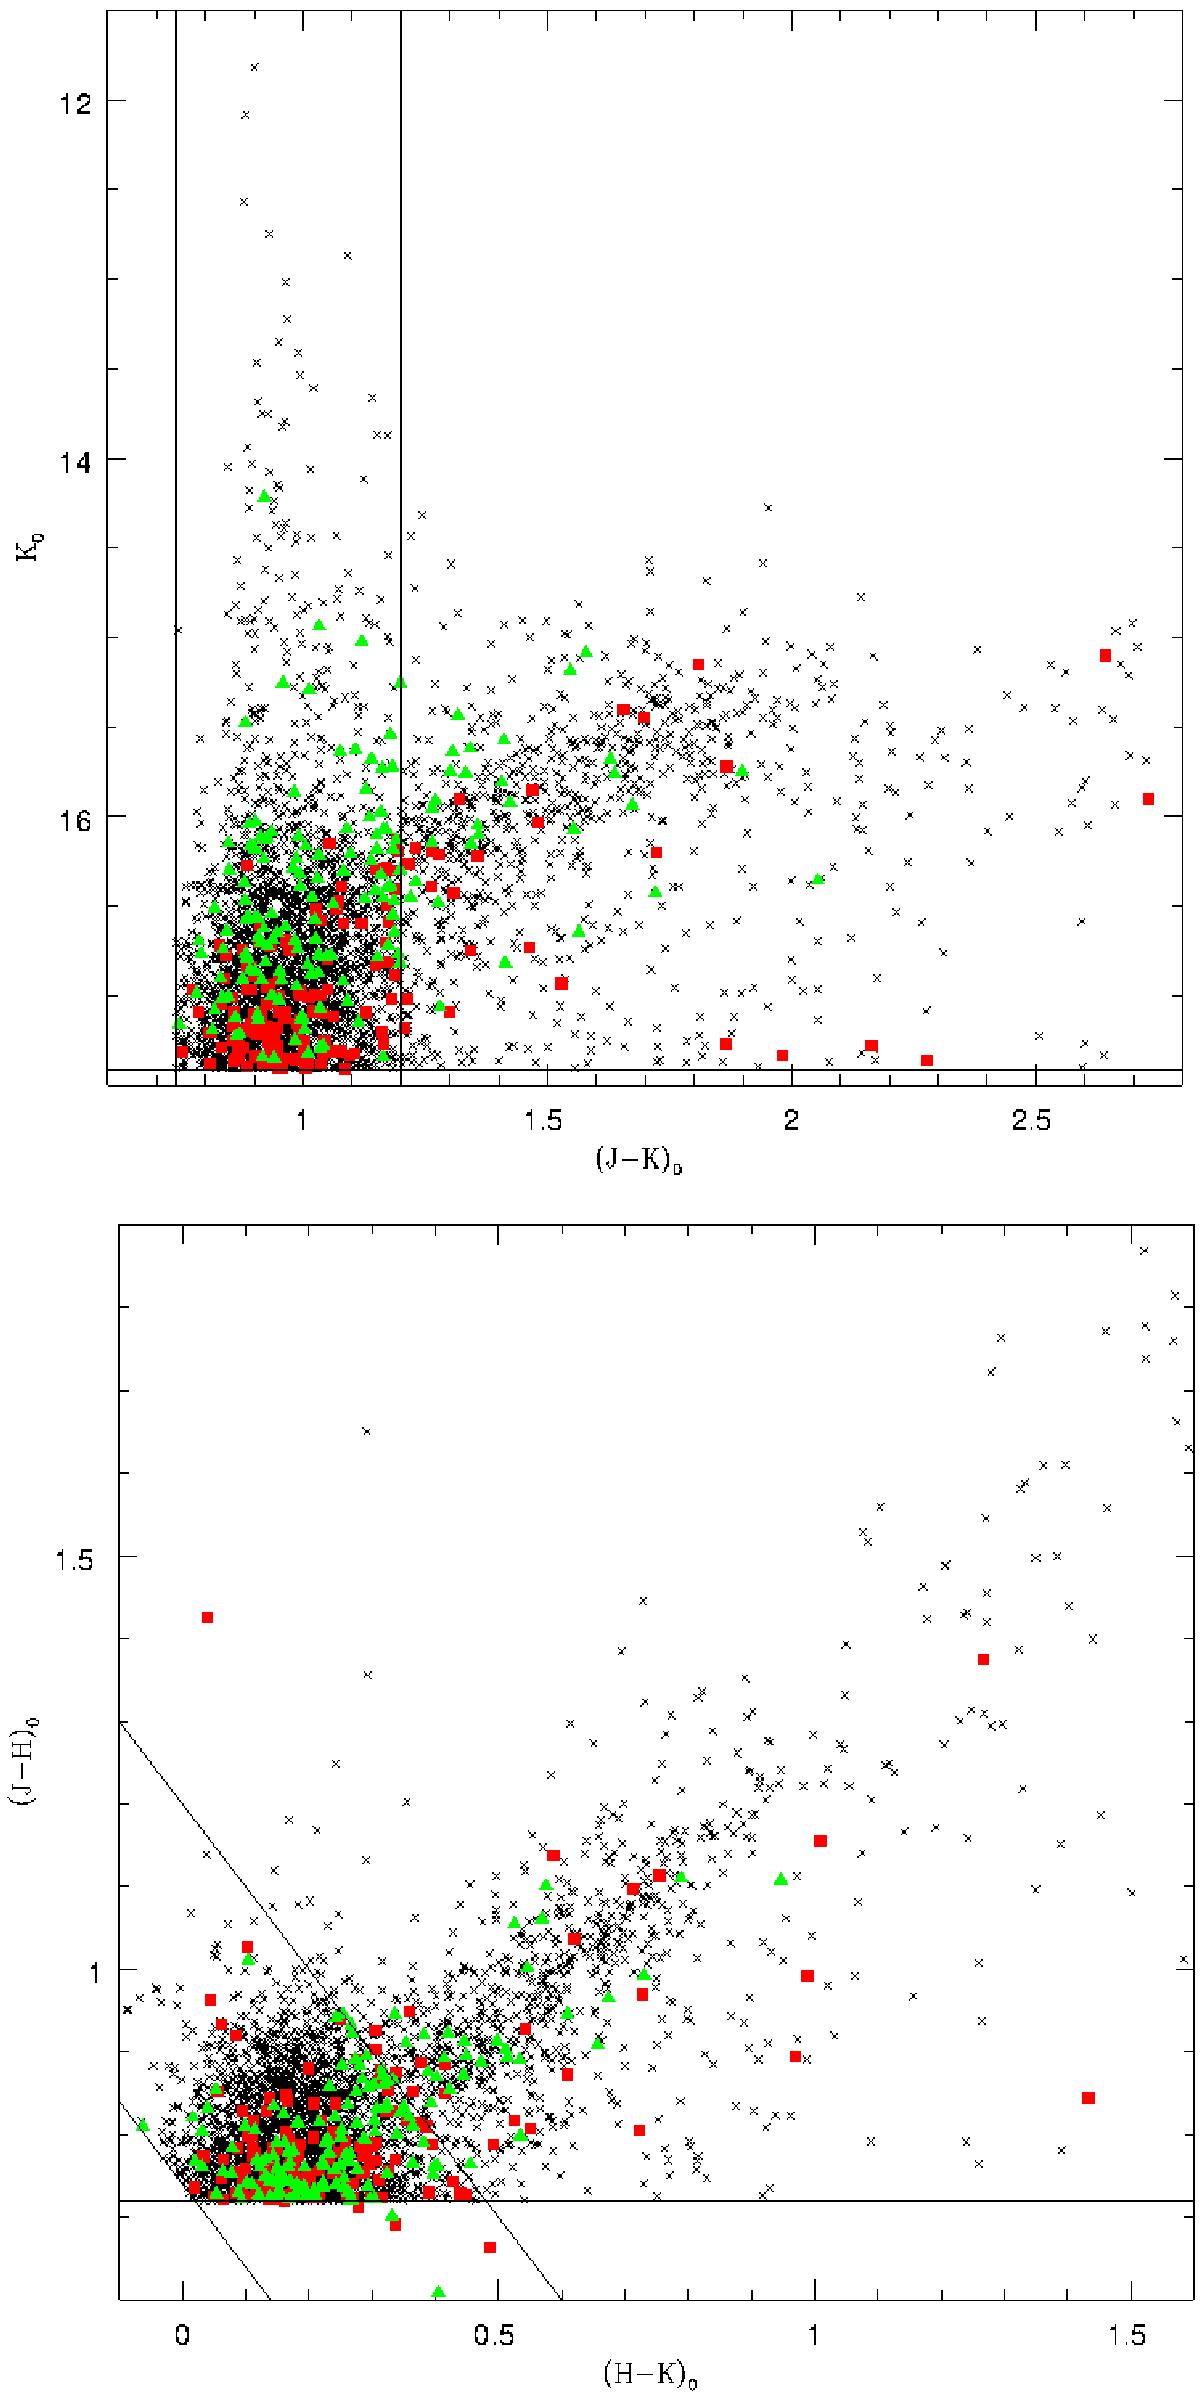
Top: CMD of the same sources as in Fig. 1. The horizontal and vertical lines mark the position of the tip of the red giant branch and the (J − K)0 colour criteria used in Paper I. Bottom: colour–colour diagram of the same sources. The horizontal line marks the (J − H)0 colour cut used in Paper I to remove contaminating foreground sources. The diagonal lines represent the (J − K)0 colour boundaries used to select C- and the M-type sources.
Current usage metrics show cumulative count of Article Views (full-text article views including HTML views, PDF and ePub downloads, according to the available data) and Abstracts Views on Vision4Press platform.
Data correspond to usage on the plateform after 2015. The current usage metrics is available 48-96 hours after online publication and is updated daily on week days.
Initial download of the metrics may take a while.