Fig. 19
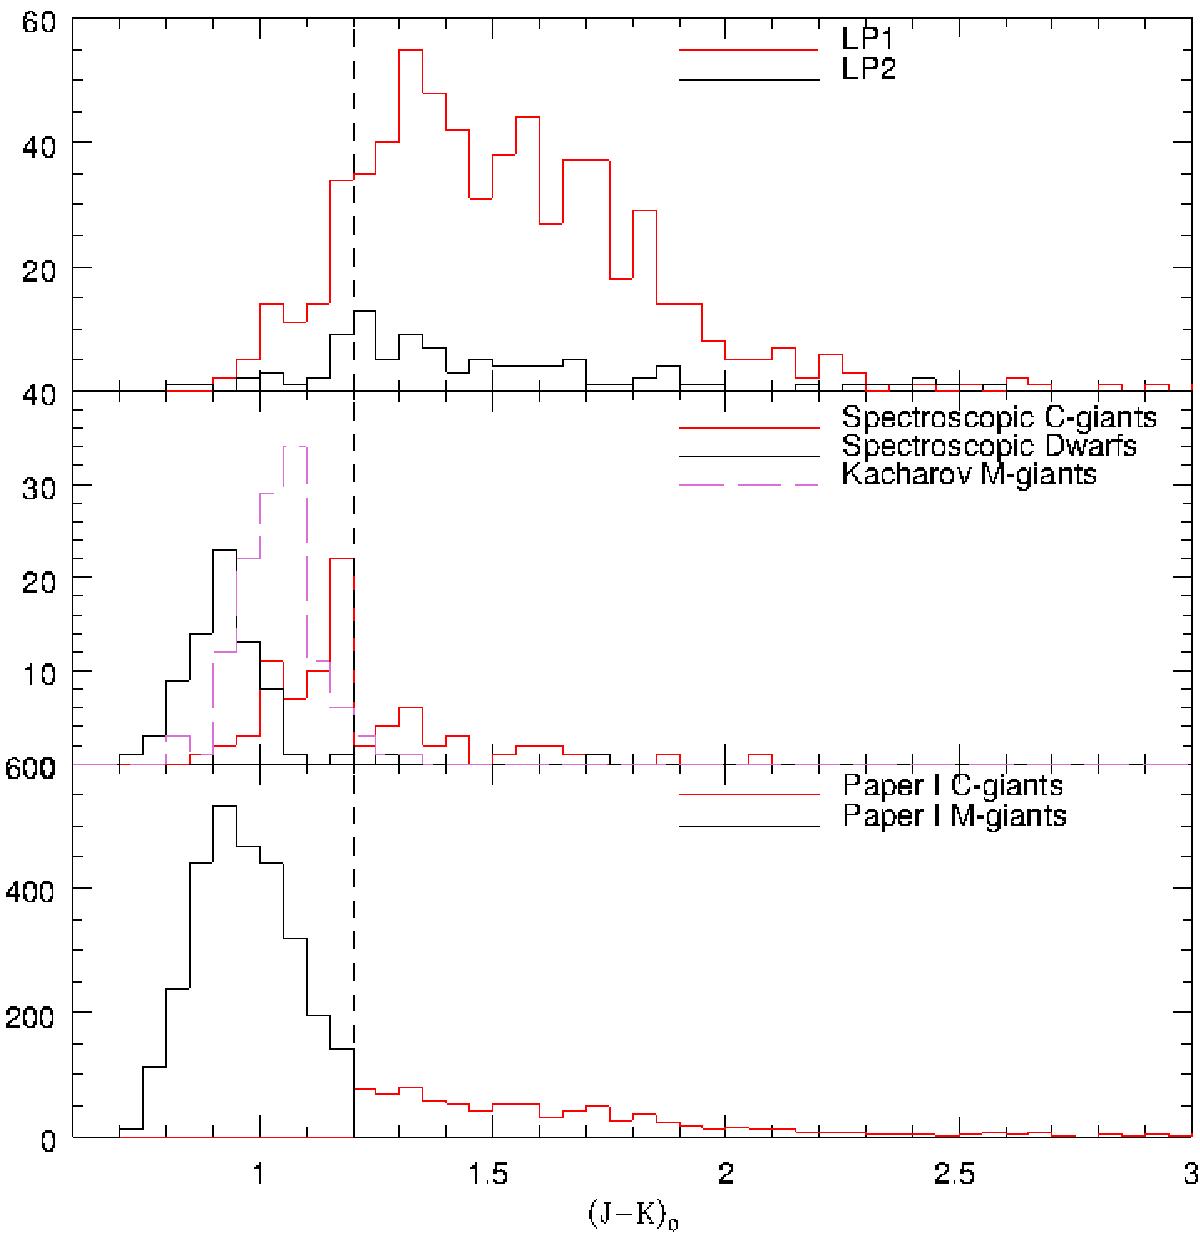
(J − K)0 colour histograms in 0.05 mag bins. Top: the distributions of the LP1 (red) and LP2 (black) samples. Middle: colour histograms for the spectroscopic sample presented here. The K- and M-type dwarf sources (black) and the C-type sources (red). A colour histogram (purple) for the spectroscopically confirmed M-type giants of Kacharov et al. (2012) is also shown. Bottom: as above for the sources classified as M-type (black) and the sources classified as C-type (red) in Catalogue 1 of Paper I. The dashed vertical line at (J − K)0 = 1.20 mag marks the position of the colour boundary used in Paper I.
Current usage metrics show cumulative count of Article Views (full-text article views including HTML views, PDF and ePub downloads, according to the available data) and Abstracts Views on Vision4Press platform.
Data correspond to usage on the plateform after 2015. The current usage metrics is available 48-96 hours after online publication and is updated daily on week days.
Initial download of the metrics may take a while.