Fig. 17
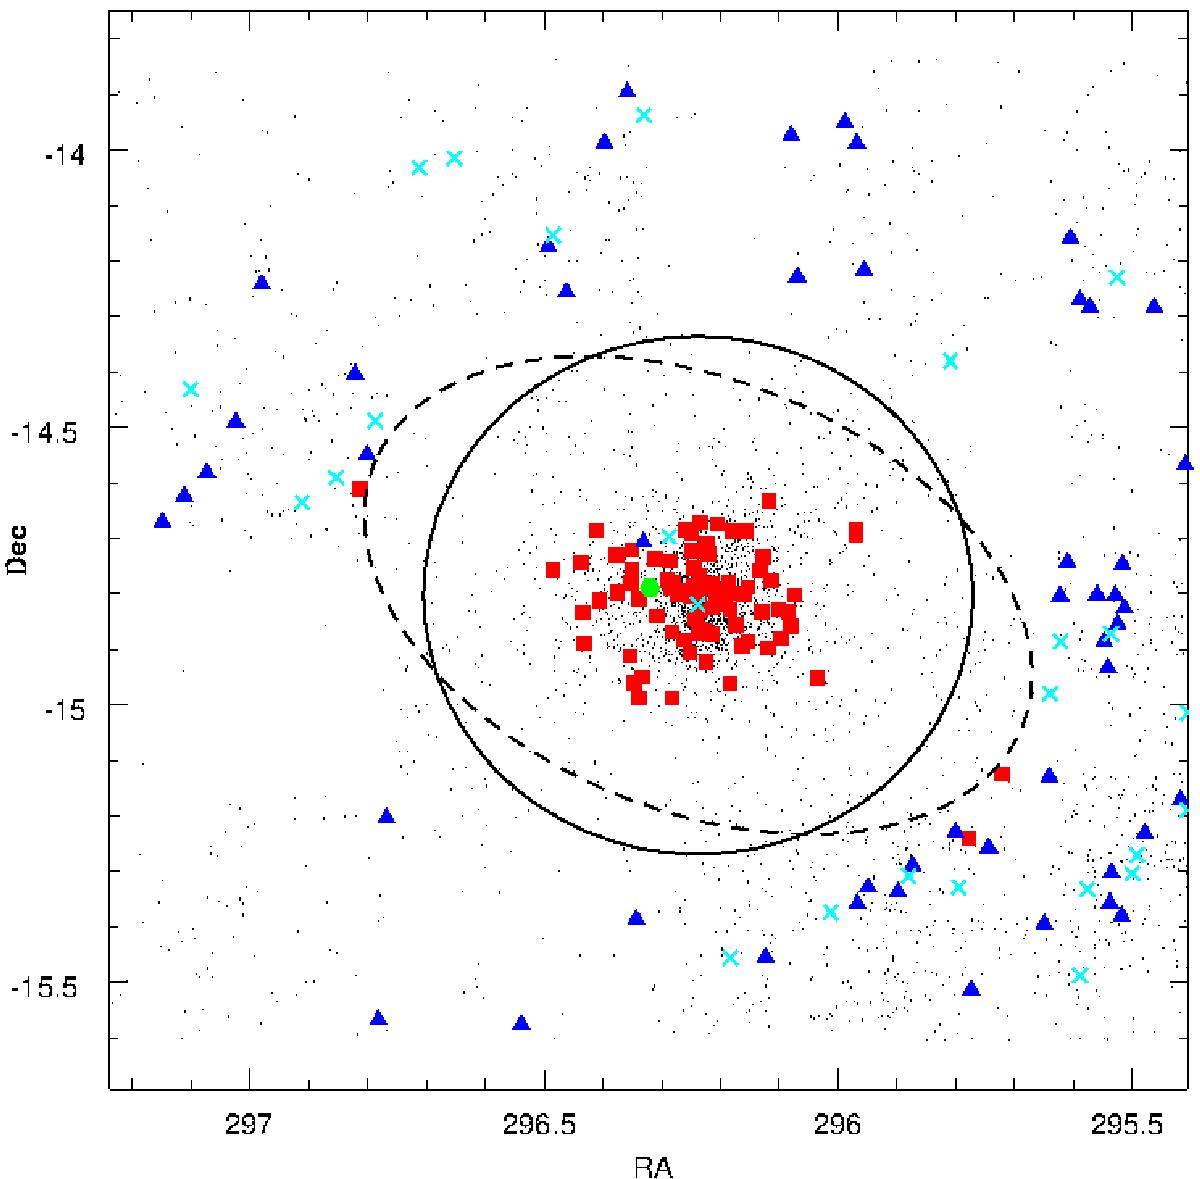
Distribution of all the candidate AGB sources (black dots) identified in Paper I. Overlayed are sources from our spectroscopic sample. Symbols have the same meaning as in Fig. 5. The circle (solid line) marks the position of the 4 kpc limit inferred in Paper I. The ellipse of Battinelli et al. (2006, dashed line) is shown and has a semi-major axis of 34′ at the assumed distance modulus assumed in Paper I, (m − M)0 = 23.45 ± 0.05.
Current usage metrics show cumulative count of Article Views (full-text article views including HTML views, PDF and ePub downloads, according to the available data) and Abstracts Views on Vision4Press platform.
Data correspond to usage on the plateform after 2015. The current usage metrics is available 48-96 hours after online publication and is updated daily on week days.
Initial download of the metrics may take a while.