Free Access
Fig. 12
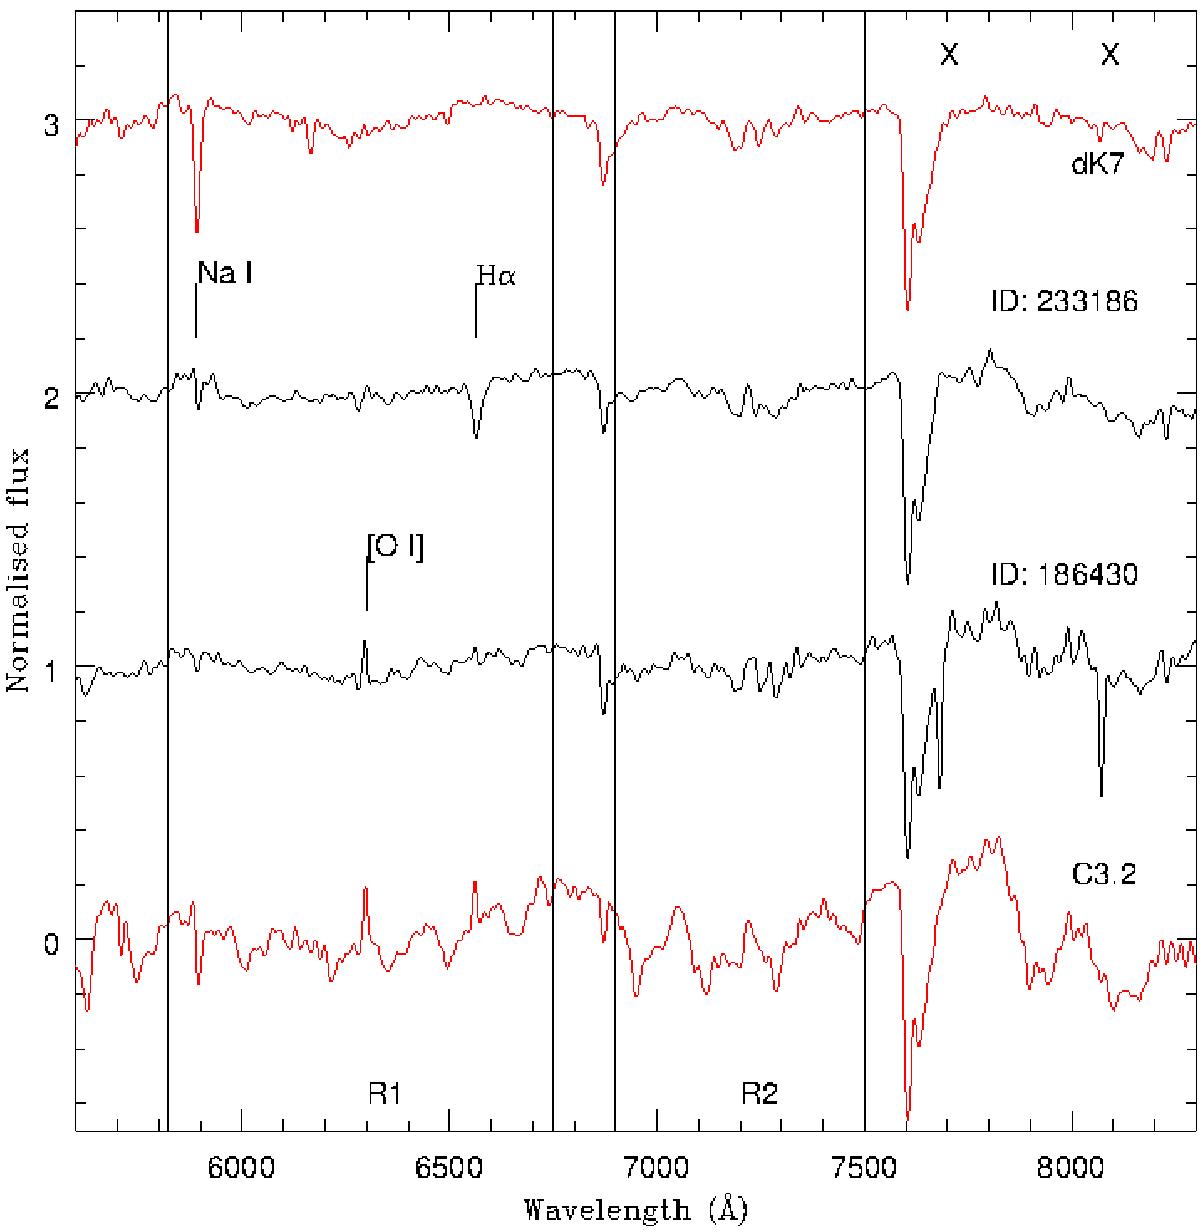
Spectra of the two unclassified sources in the inner region (solid black lines). At the bottom we have plotted the average C3.2 spectrum and at the top we have plotted the average dK7 spectrum (solid red lines) for comparison. The crosses mark the positions of spurious features (Sect. 2.2).
Current usage metrics show cumulative count of Article Views (full-text article views including HTML views, PDF and ePub downloads, according to the available data) and Abstracts Views on Vision4Press platform.
Data correspond to usage on the plateform after 2015. The current usage metrics is available 48-96 hours after online publication and is updated daily on week days.
Initial download of the metrics may take a while.