Fig. 11
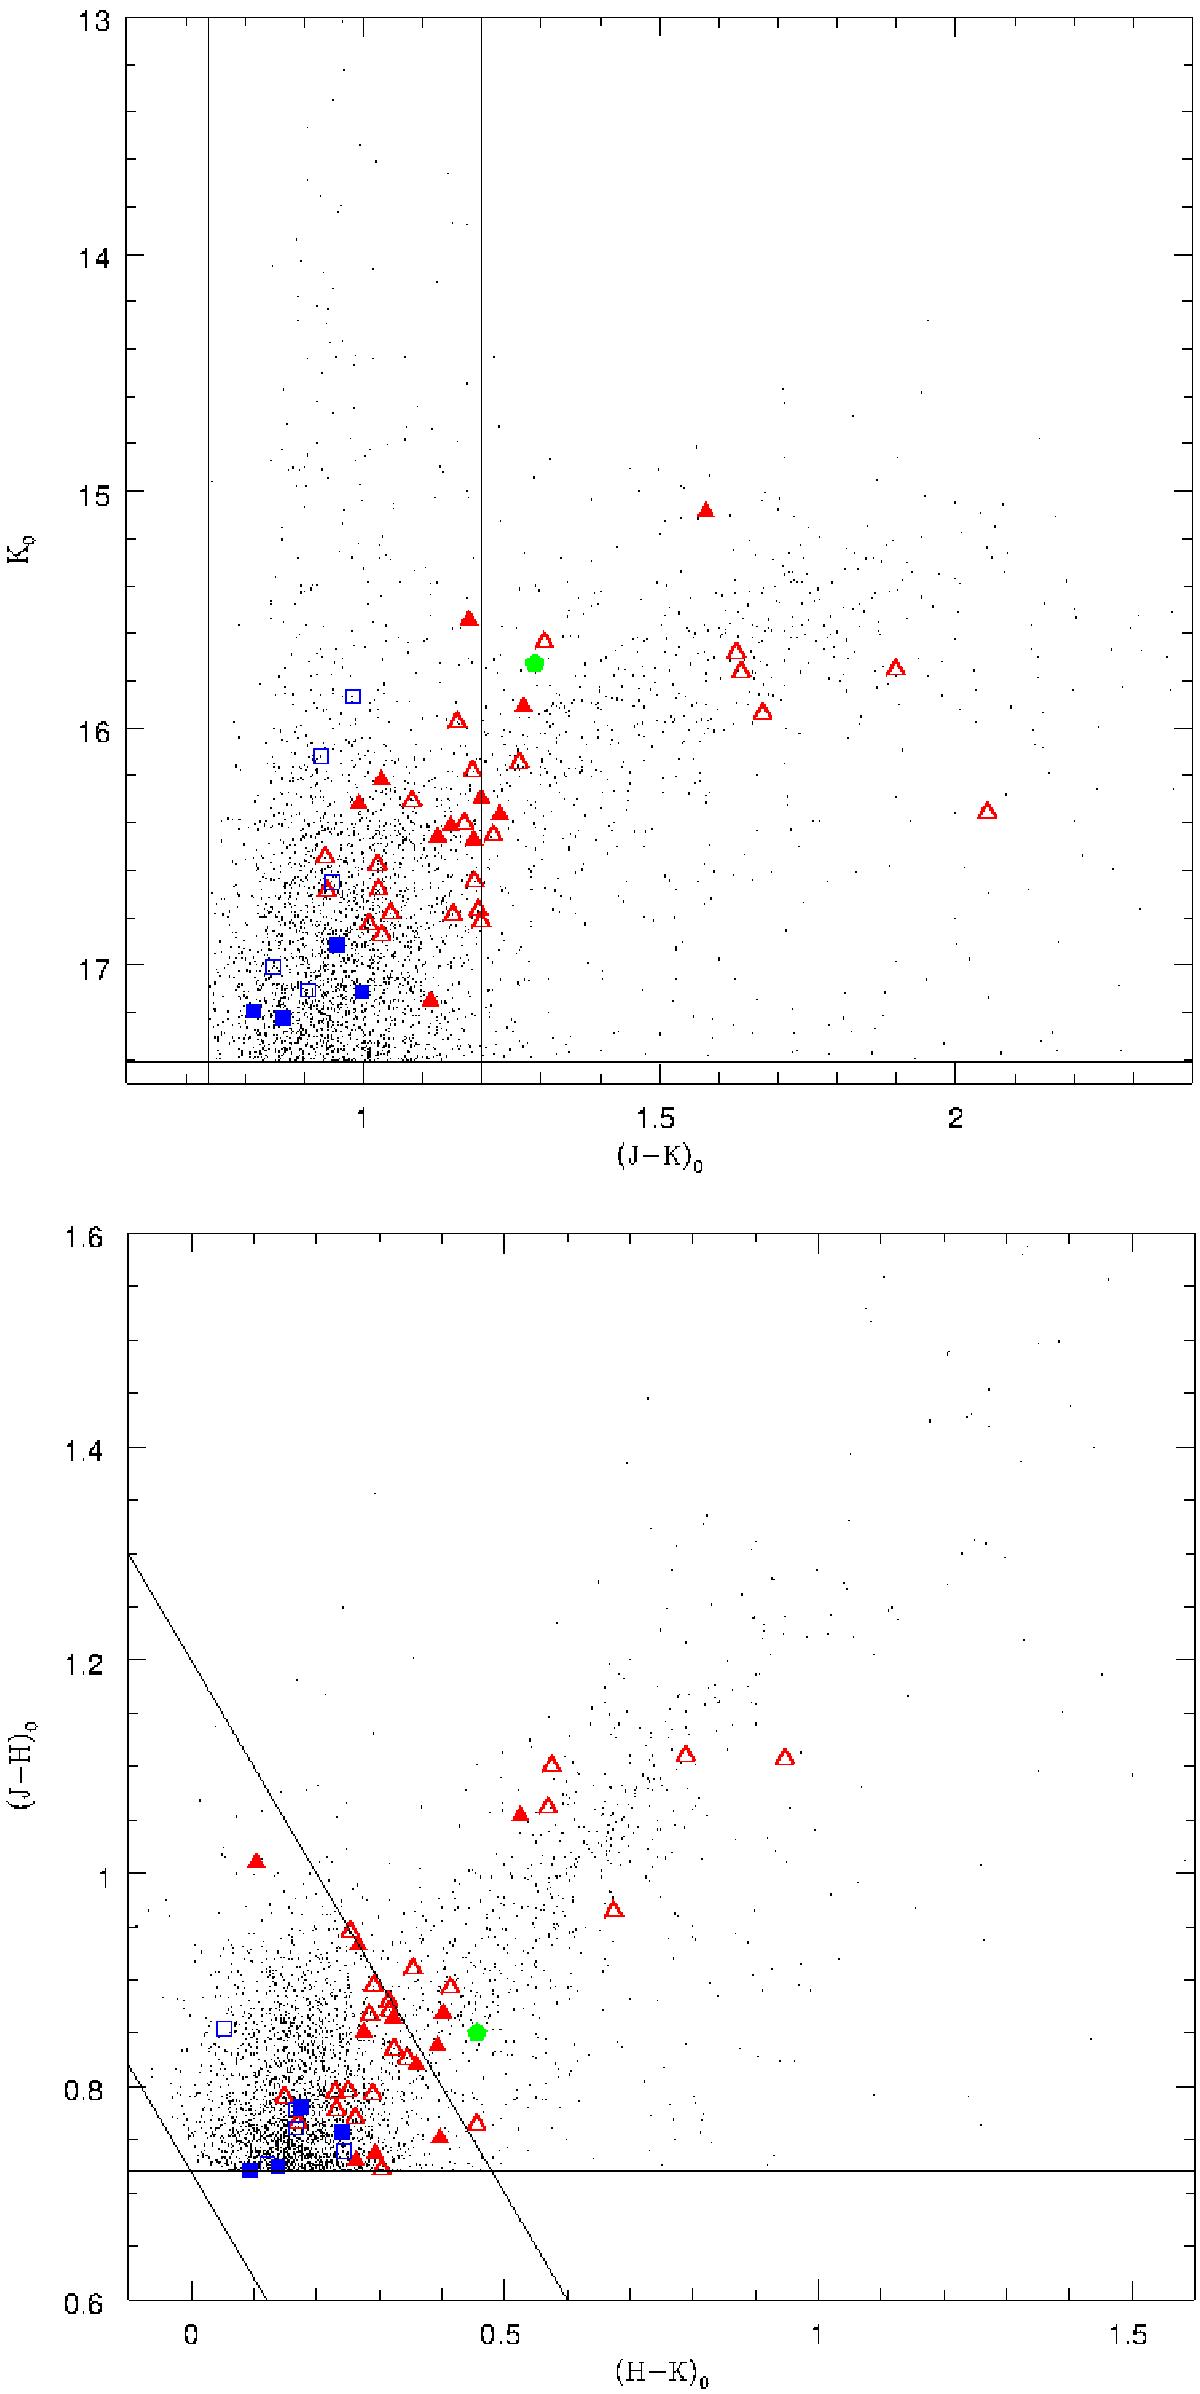
Top: high (solid shapes) and low ionisation (open shapes) sources from the inner (red triangles) and outer (blue squares) regions are plotted on a CMD of the AGB sources from Paper I. The horizontal and vertical lines mark the selection criteria used in that paper. The green pentagon marks the position of NGC 6822 SySt 1 (Kniazev et al. 2009). Bottom: same sources plotted on a (H − K, J − H)0 colour–colour diagram. The horizontal and diagonal lines mark the selection criteria used in Paper I.
Current usage metrics show cumulative count of Article Views (full-text article views including HTML views, PDF and ePub downloads, according to the available data) and Abstracts Views on Vision4Press platform.
Data correspond to usage on the plateform after 2015. The current usage metrics is available 48-96 hours after online publication and is updated daily on week days.
Initial download of the metrics may take a while.