Fig. 4
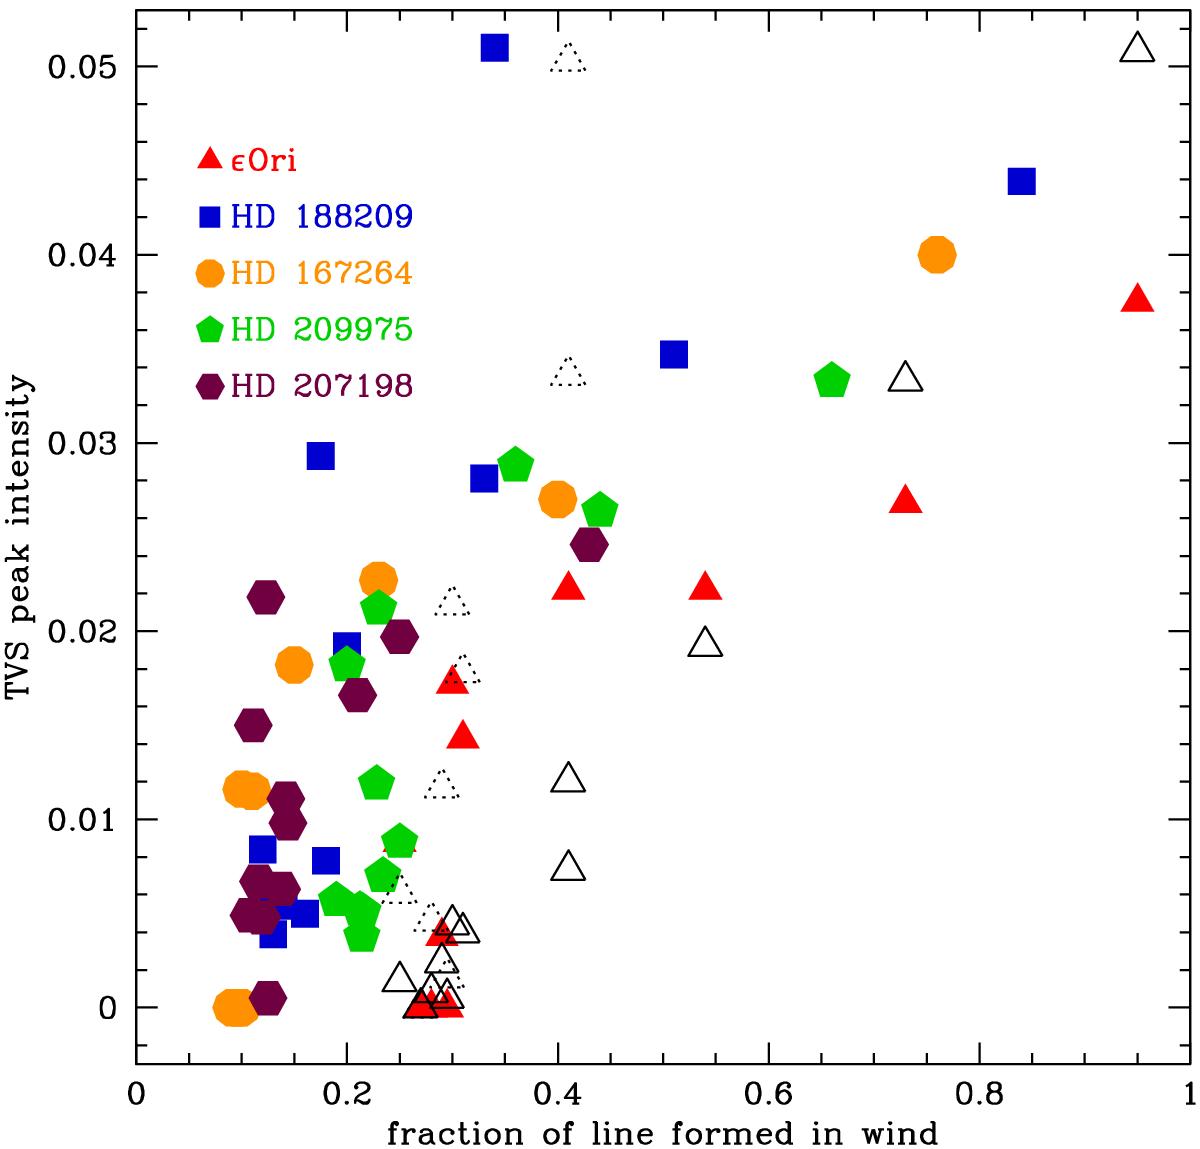
TVS peak intensity as a function of fraction of the line formed in the wind. Filled symbols correspond to the sample stars showing variability on a daily timescale. The solid open triangles show the variability of synthetic lines for which the mass loss rate varies by 25%, starting from the best fit model of ϵ Ori. The dotted triangles represent the theoretical variability due to changes in β (from 0.8 to 1.4) in the best fit model of ϵ Ori. The points for Hα, Hβ, and Hγ are out of the plot (amplitudes of 0.135, 0.104, and 0.070, respectively).
Current usage metrics show cumulative count of Article Views (full-text article views including HTML views, PDF and ePub downloads, according to the available data) and Abstracts Views on Vision4Press platform.
Data correspond to usage on the plateform after 2015. The current usage metrics is available 48-96 hours after online publication and is updated daily on week days.
Initial download of the metrics may take a while.