Fig. 3
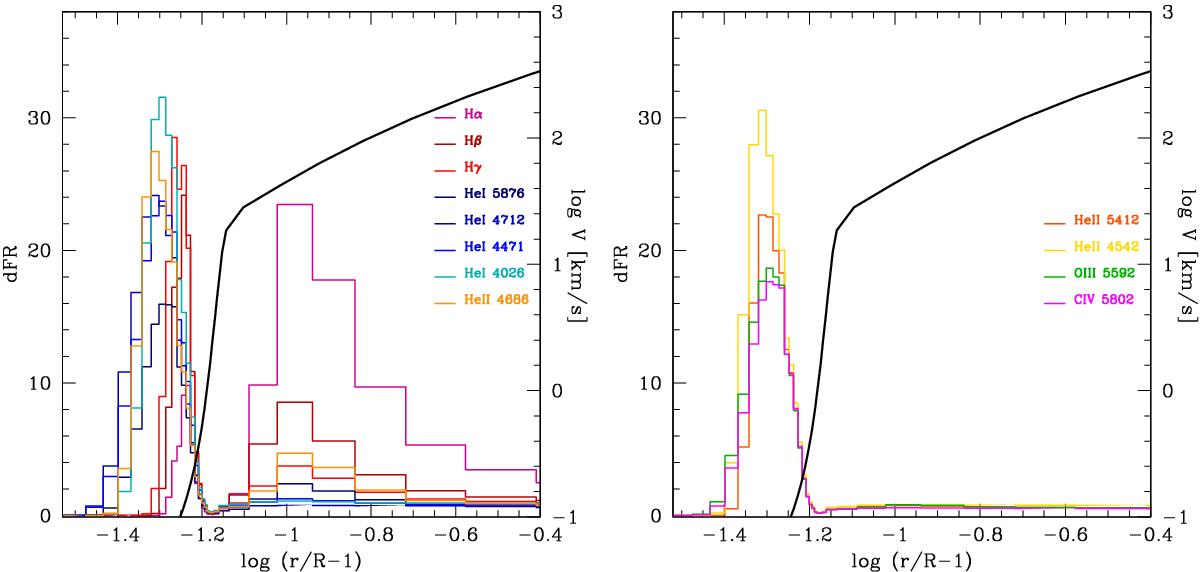
Formation region of lines shown in Figs. 1. The contribution function for a given line (in arbitrary units) is shown as a function of height above the photosphere. Left: lines showing variability in Fig. 1. Right: lines not showing variability in Fig. 1. The black solid line in both panels is the velocity structure in the best fit model.
Current usage metrics show cumulative count of Article Views (full-text article views including HTML views, PDF and ePub downloads, according to the available data) and Abstracts Views on Vision4Press platform.
Data correspond to usage on the plateform after 2015. The current usage metrics is available 48-96 hours after online publication and is updated daily on week days.
Initial download of the metrics may take a while.