Free Access
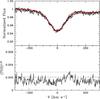
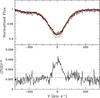
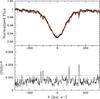
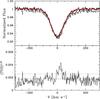
Fig. 1
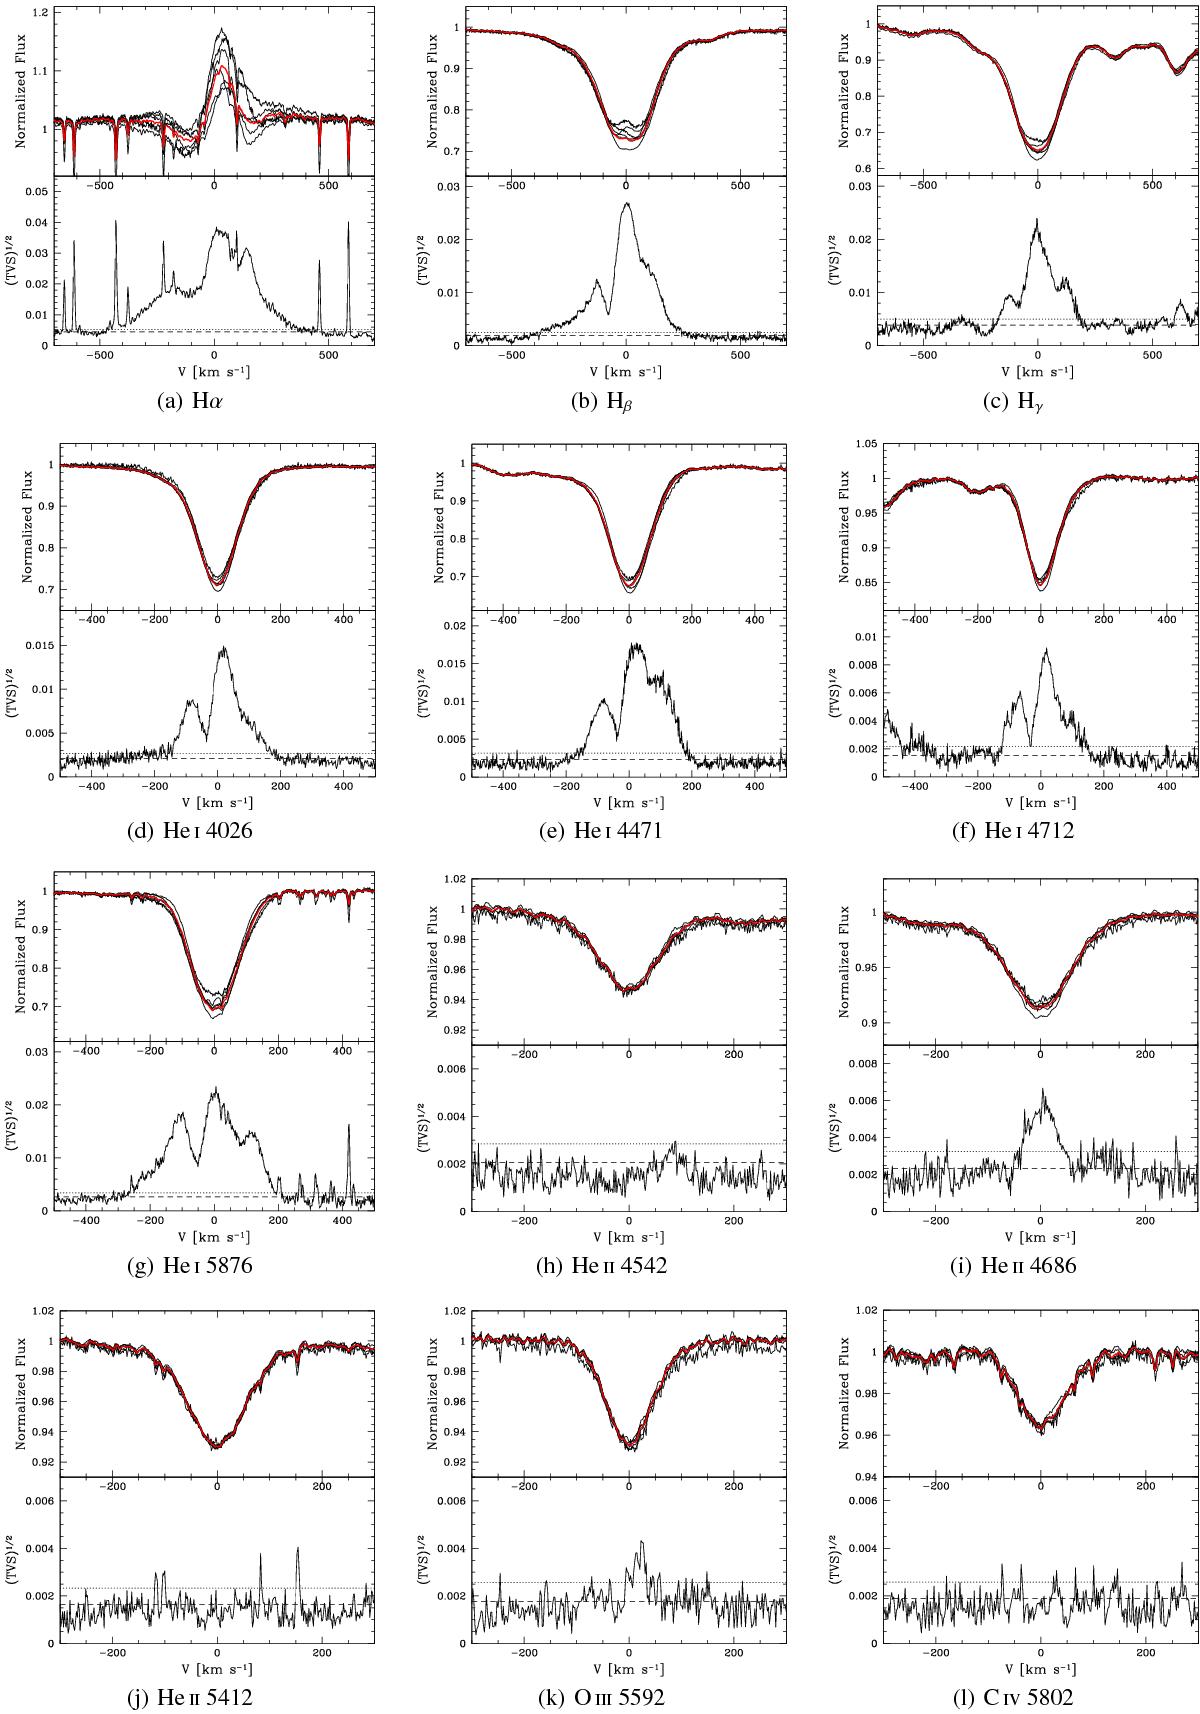
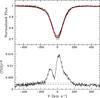
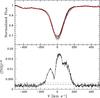
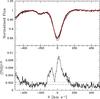
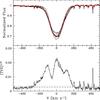
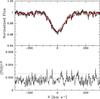
Variability of ϵ Ori on a daily timescale (from 16 to 25, October 2007). Upper panels: individual spectra in black (each spectrum corresponds to a night average) and global average spectrum in red. Lower panels: temporal variance spectrum, together with the one-sigma (dashed line) and three-sigma (dot-dashed line) limits.
This figure is made of several images, please see below:
Current usage metrics show cumulative count of Article Views (full-text article views including HTML views, PDF and ePub downloads, according to the available data) and Abstracts Views on Vision4Press platform.
Data correspond to usage on the plateform after 2015. The current usage metrics is available 48-96 hours after online publication and is updated daily on week days.
Initial download of the metrics may take a while.