Fig. 5
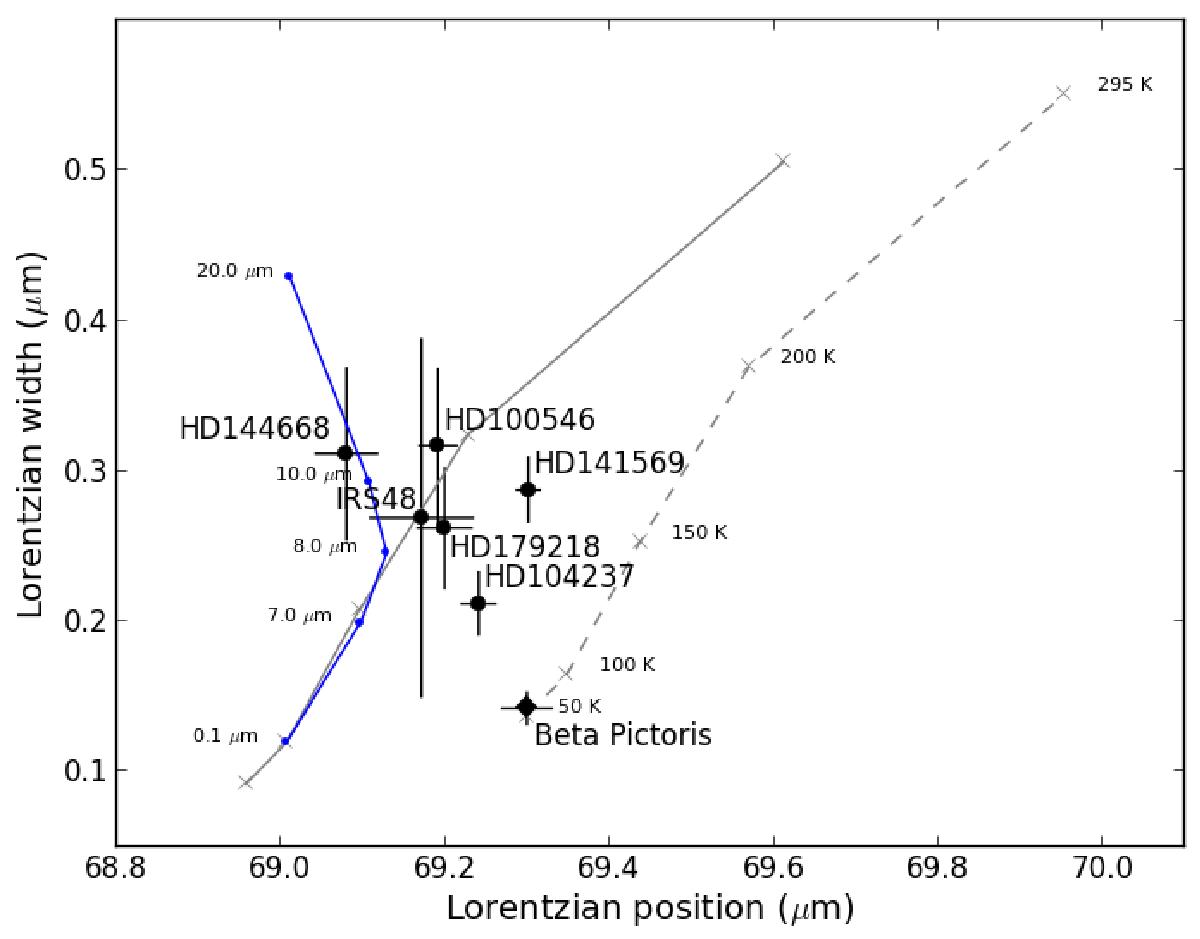
Lorentzian width versus peak position diagram of 69 micron features (Gaussian values in Table 1). The left solid blue line shows the peak positions and widths for a T = 100 K grain with increasing size between 0.1 μm and 20 μm, computed with a distribution of hollow spheres (DHS). The left solid grey line represents the peak positions and widths for iron free forsterite and increasing temperatures of 50 K, 100 K, 150 K, 200 K, and 295 from laboratory measurements of Suto et al. (2006). The right dashed grey line shows the interpolated shift in peak positions and widths for the 69 μm feature for 1% iron fraction (Koike et al. 2003).
Current usage metrics show cumulative count of Article Views (full-text article views including HTML views, PDF and ePub downloads, according to the available data) and Abstracts Views on Vision4Press platform.
Data correspond to usage on the plateform after 2015. The current usage metrics is available 48-96 hours after online publication and is updated daily on week days.
Initial download of the metrics may take a while.