Fig. 4
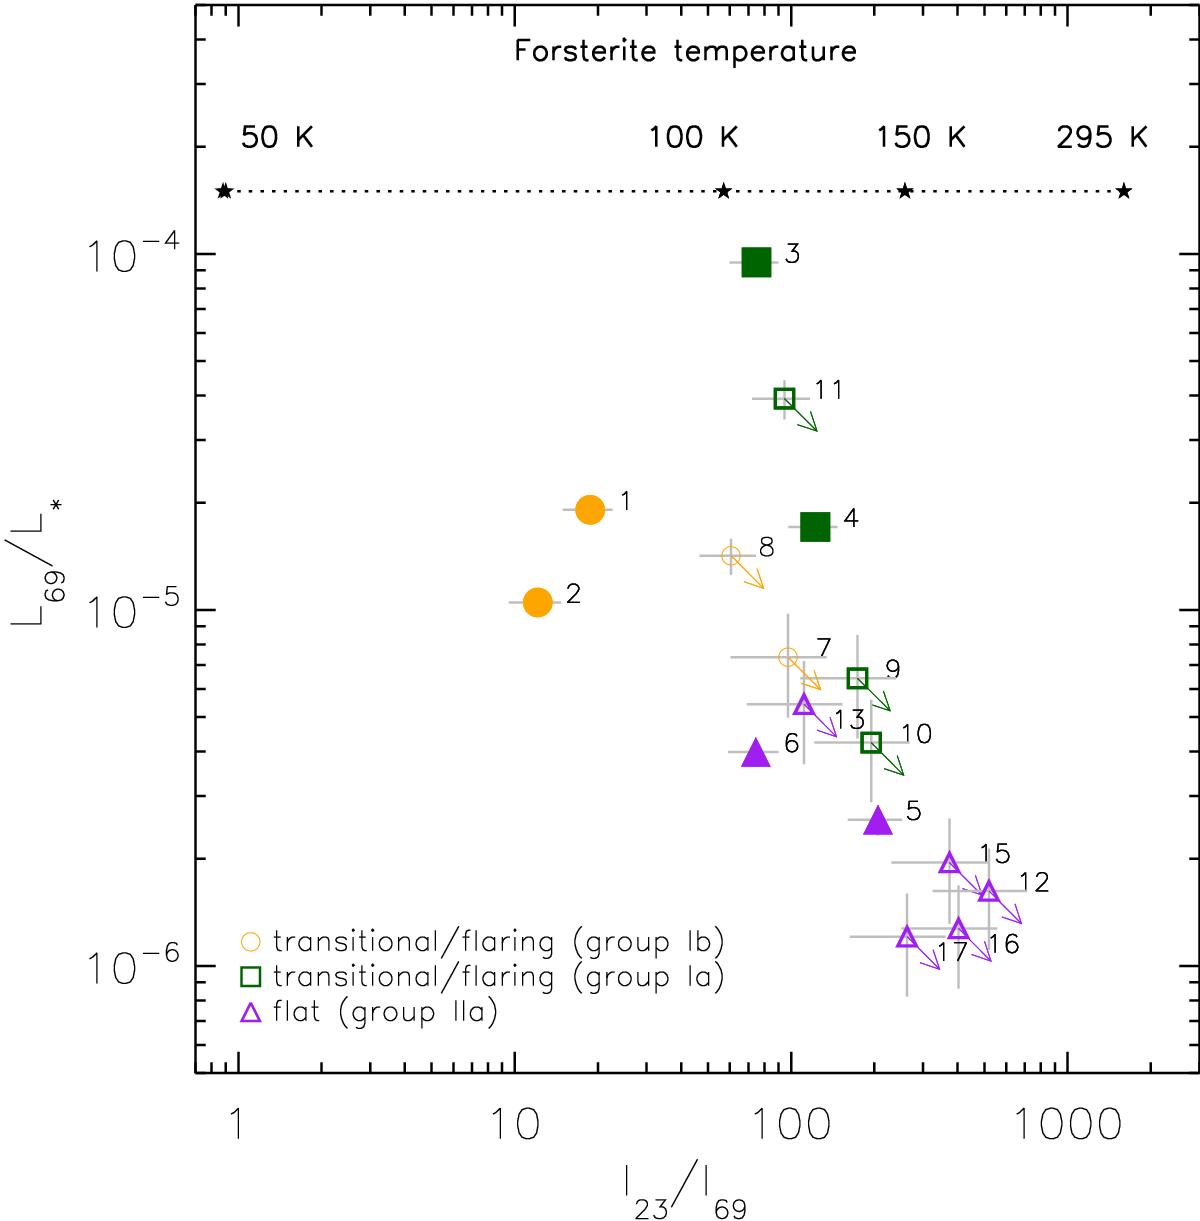
Luminosity of the 69 μm feature (L69/L∗) compared with the I23/I69 ratio. Filled symbols indicate the objects for which the 69 μm feature has been detected. The numbers refer to the objects and are given in Table 2. The arrows indicate the upper limits of the 69 μm feature. The stars indicate band-strength ratios of temperature-dependent forsterite opacities multiplied by black bodies of corresponding temperatures. Thus the emission profile of optically thin dust emission is modelled and serves as a simple first comparison to the observed feature ratios.
Current usage metrics show cumulative count of Article Views (full-text article views including HTML views, PDF and ePub downloads, according to the available data) and Abstracts Views on Vision4Press platform.
Data correspond to usage on the plateform after 2015. The current usage metrics is available 48-96 hours after online publication and is updated daily on week days.
Initial download of the metrics may take a while.