Fig. 3
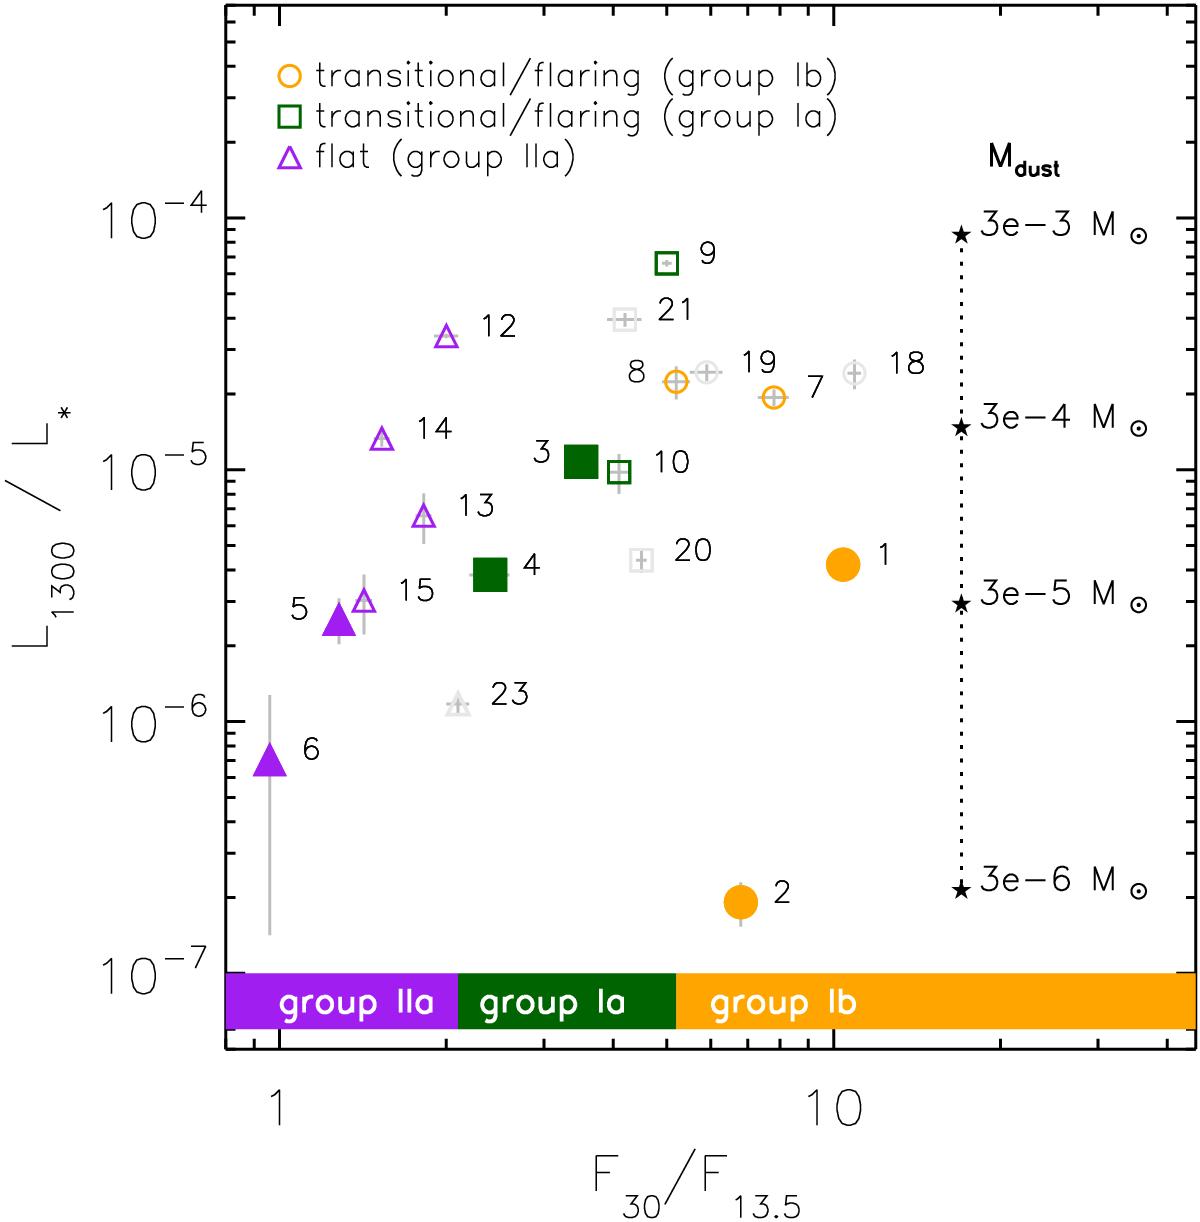
Disk luminosity at 1.3 mm (L1300/L∗) compared with the MIR spectral index F13.5/F30 ratio. Filled symbols indicate the objects for which the 69 μm feature has been detected. The 69 μm feature is often detected for disks with low L1300/L∗. The MIR spectral index can be used as a tracer of large disk gaps. The symbols show flaring/transitional disks without silicate features (group Ib, orange circles, ![]() ), with silicate features (group Ia, dark green squares, 2.1 <F30/F13.5< 5.1), and self-shadowed disks with silicate features (group IIa, purple triangles,
), with silicate features (group Ia, dark green squares, 2.1 <F30/F13.5< 5.1), and self-shadowed disks with silicate features (group IIa, purple triangles, ![]() ). The numbers refer to the objects and are given in Table 2. The grey symbols show the objects without forsterite detections at Spitzer/IRS and Herschel/PACS wavelengths.
). The numbers refer to the objects and are given in Table 2. The grey symbols show the objects without forsterite detections at Spitzer/IRS and Herschel/PACS wavelengths.
Current usage metrics show cumulative count of Article Views (full-text article views including HTML views, PDF and ePub downloads, according to the available data) and Abstracts Views on Vision4Press platform.
Data correspond to usage on the plateform after 2015. The current usage metrics is available 48-96 hours after online publication and is updated daily on week days.
Initial download of the metrics may take a while.