Fig. 6
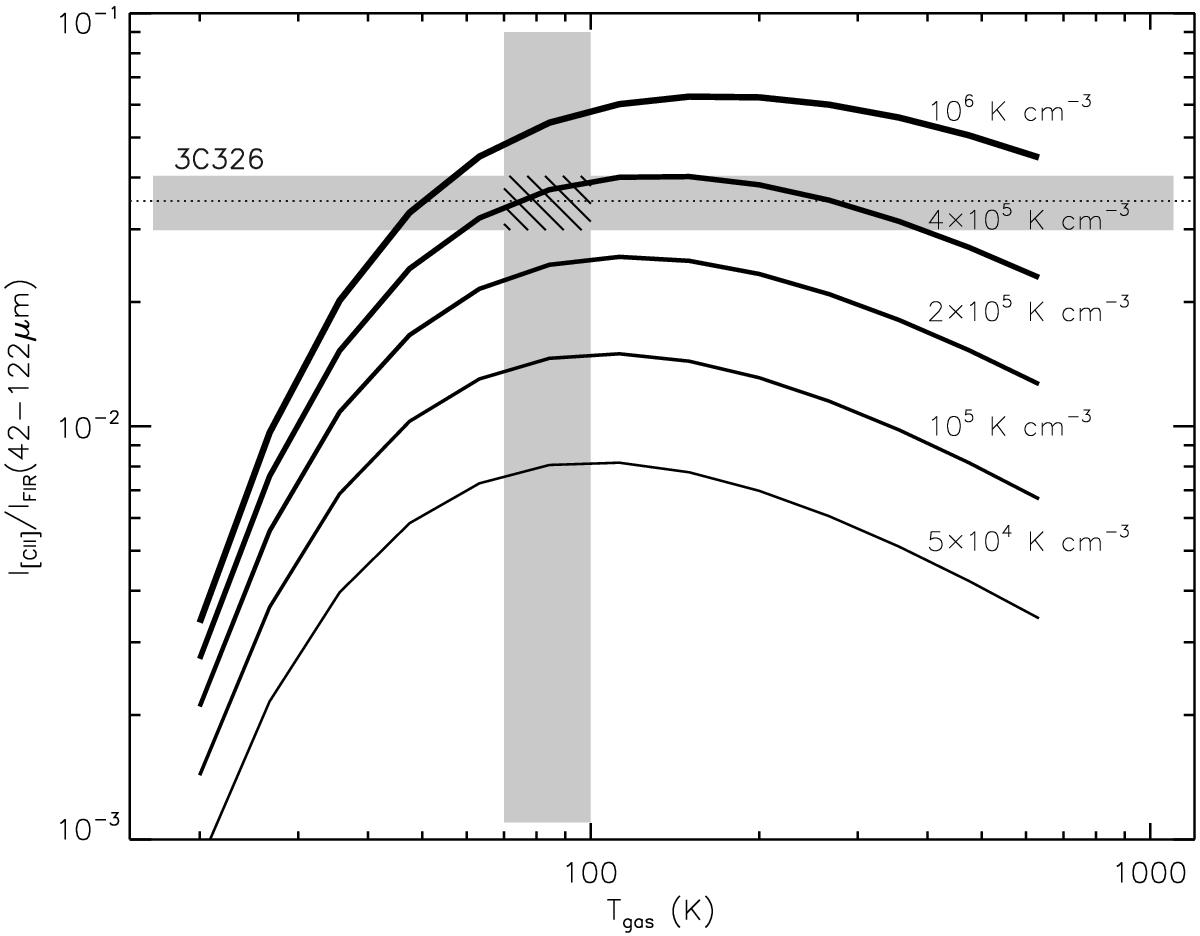
[Cii]λ 158 μm to FIR intensity ratio as a function of the gas temperature for different constant gas thermal pressures. The [Cii] cooling is computed from Eq. (2) and the FIR flux from the integration of our dust model over the range 42 − 122 μm (with a radiation field G0 = 9, see Sect. 4.2 and Fig. 5). The observed ratio for 3C 326N, I[CII]/IFIR(42 − 122 μm) = 0.035 ± 0.014 is indicated by the horizontal dotted line and the grey area represents the uncertainty, dominated by the large error on the SPIRE measurements. The vertical grey bar displays the range of gas temperatures as constrained by observations of the [Cii] to [Oi]63 μm line ratio (see Fig. 7 and Sect. 4.3). For this range of gas temperatures of 70 <T< 100 K, the range of pressures that matches both observational constraints is P/k ≈ 7 × 10⁴ − 2 × 10⁵ K cm-3.
Current usage metrics show cumulative count of Article Views (full-text article views including HTML views, PDF and ePub downloads, according to the available data) and Abstracts Views on Vision4Press platform.
Data correspond to usage on the plateform after 2015. The current usage metrics is available 48-96 hours after online publication and is updated daily on week days.
Initial download of the metrics may take a while.