Fig. 5
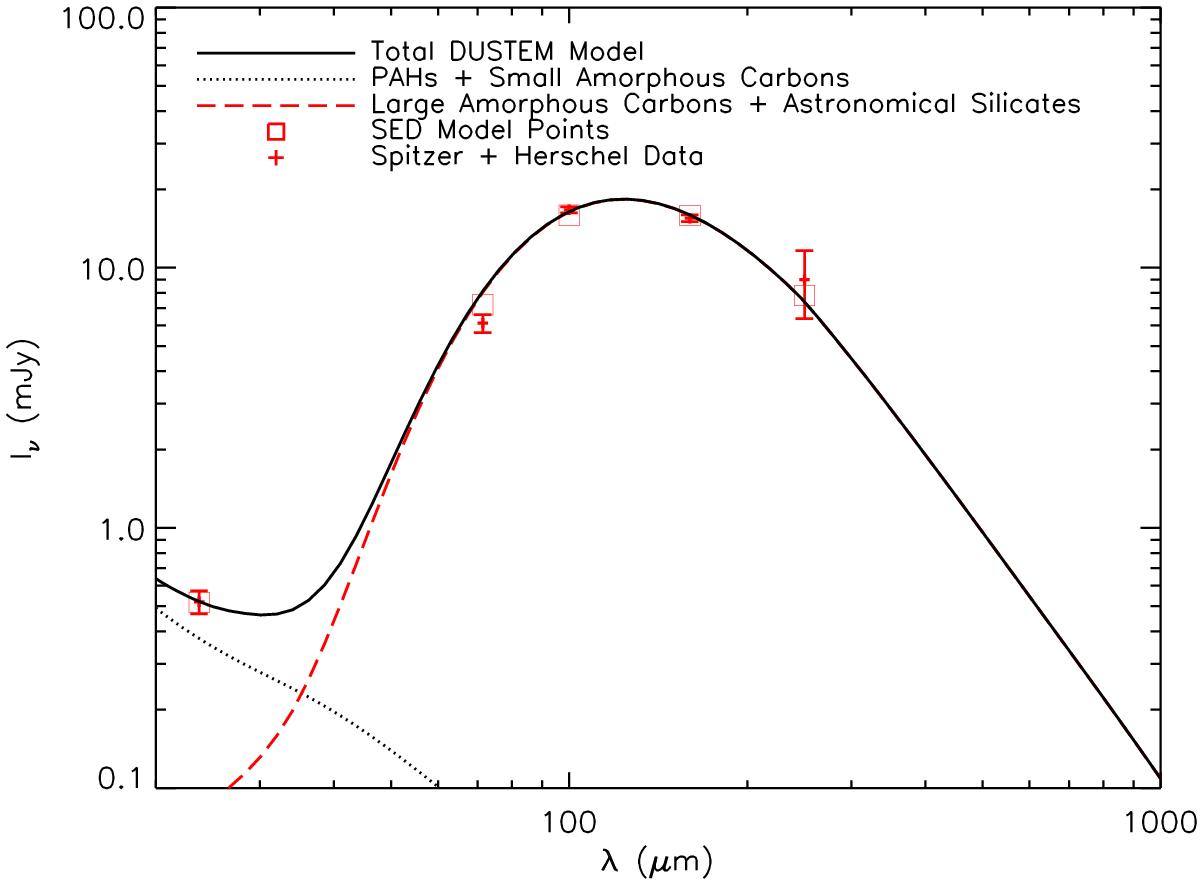
3C 326N IR spectral energy distribution fitted with the DustEm model. The blue points show the photometric data, composed of MIPS, PACS and SPIRE flux measurements (Table 2). The solid black line is the best fit DustEm model, and the dash and dotted lines show the model spectra for the two main dust grain populations used in the fit. The red squares show the photometric points computed from the model SED. Color corrections given by the instruments manuals have been applied to homogenize the different flux conventions between the instruments. The fitting routine and model SED points take the bandwidth and transmission filters of the different instruments into account (see text for details). The DustEm fit parameters used in this paper are G0 = 9 ± 1 and a dust mass of Mdust = 1.1 × 10⁷ M⊙.
Current usage metrics show cumulative count of Article Views (full-text article views including HTML views, PDF and ePub downloads, according to the available data) and Abstracts Views on Vision4Press platform.
Data correspond to usage on the plateform after 2015. The current usage metrics is available 48-96 hours after online publication and is updated daily on week days.
Initial download of the metrics may take a while.