Fig. 4
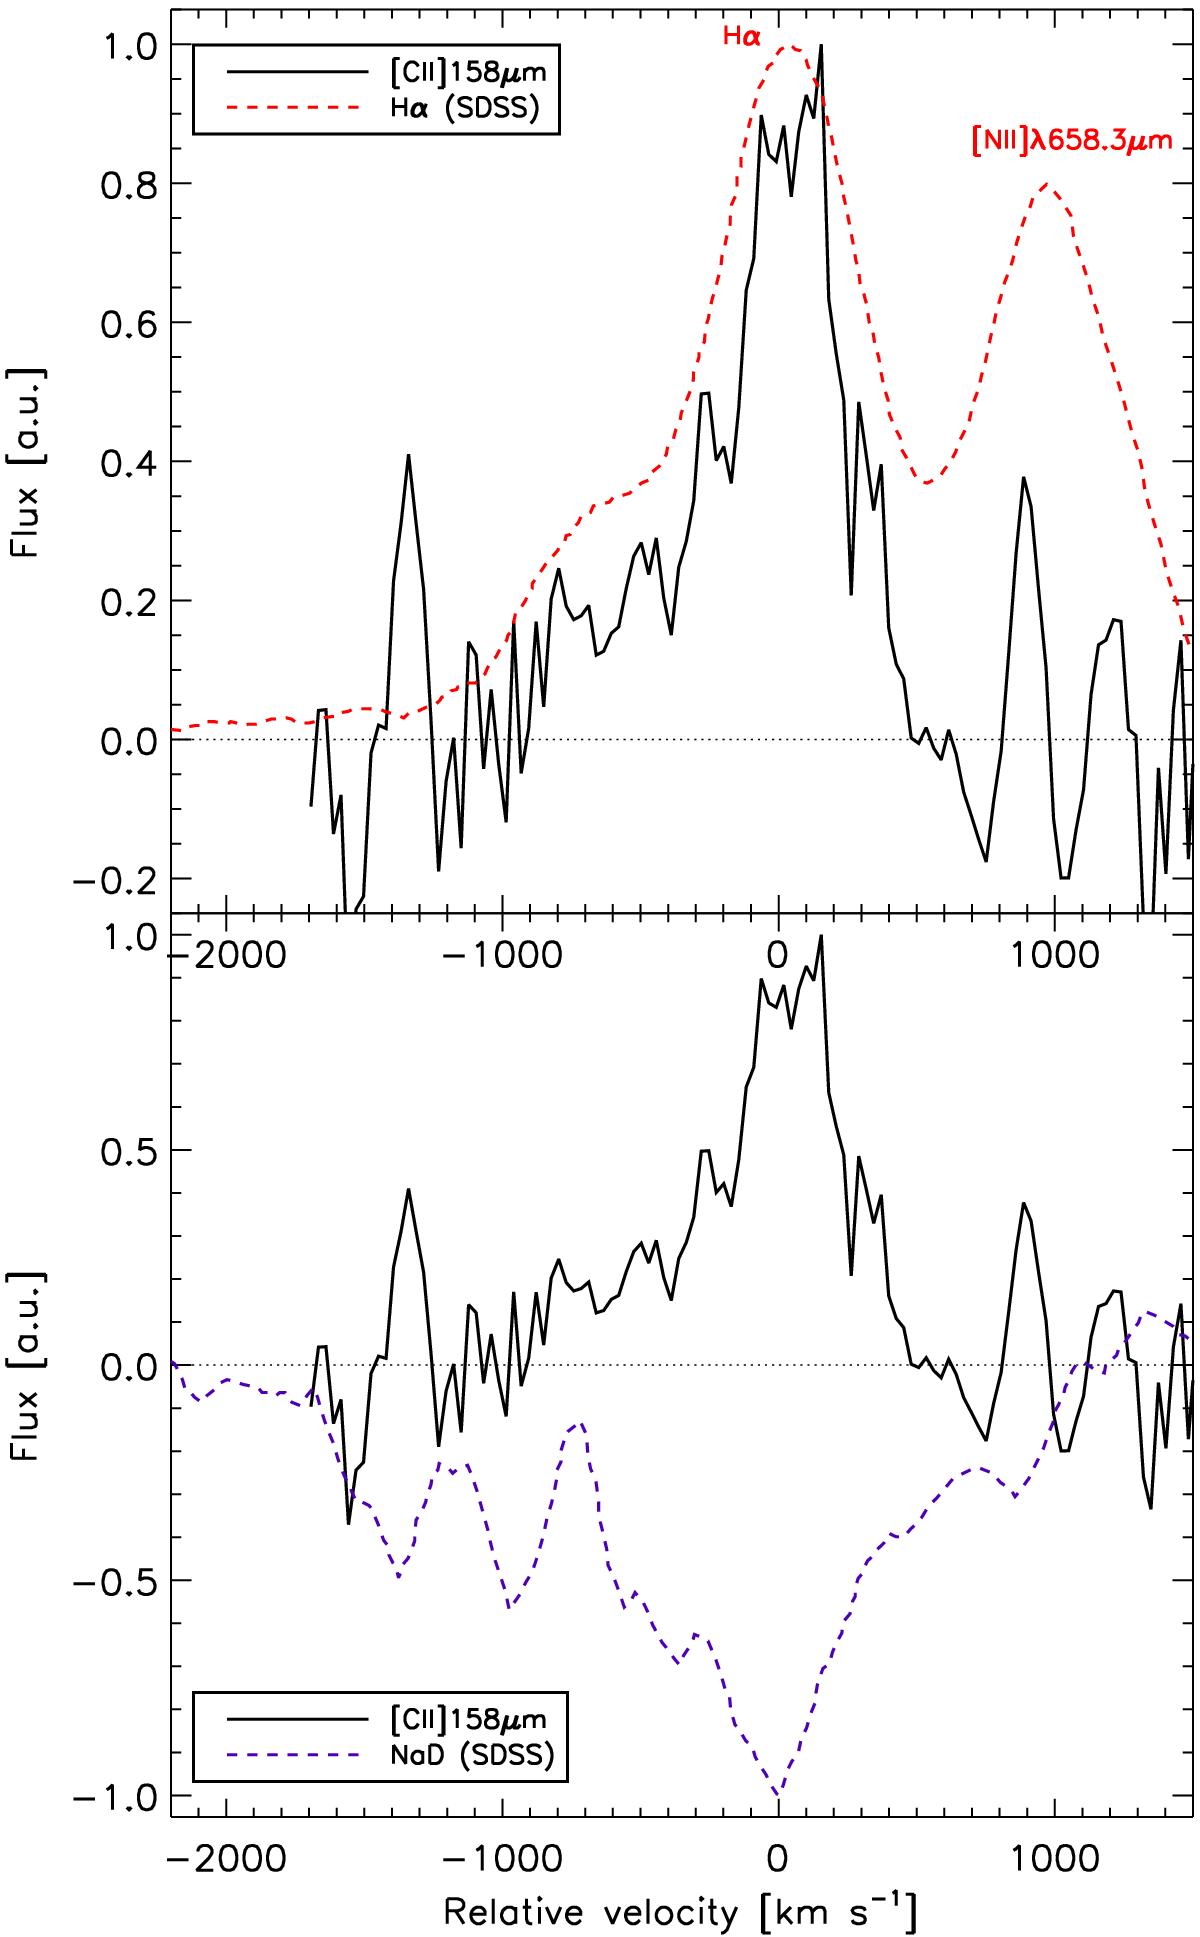
Top panel: comparison of the [Cii]λ158μm (solid black line) and Hα (dashed red line) line profiles in 3C 326N. The second line to the right of the Hα line is [Nii]λ6583 Å. Bottom panel: [Cii] (solid black line) and Na D absorption-line (dashed blue) profiles. The maximum flux of each spectrum in emission has been normalized to 1 to ease the comparison, and the minimum absorption NaD flux has been normalized to –1.
Current usage metrics show cumulative count of Article Views (full-text article views including HTML views, PDF and ePub downloads, according to the available data) and Abstracts Views on Vision4Press platform.
Data correspond to usage on the plateform after 2015. The current usage metrics is available 48-96 hours after online publication and is updated daily on week days.
Initial download of the metrics may take a while.