Fig. 3
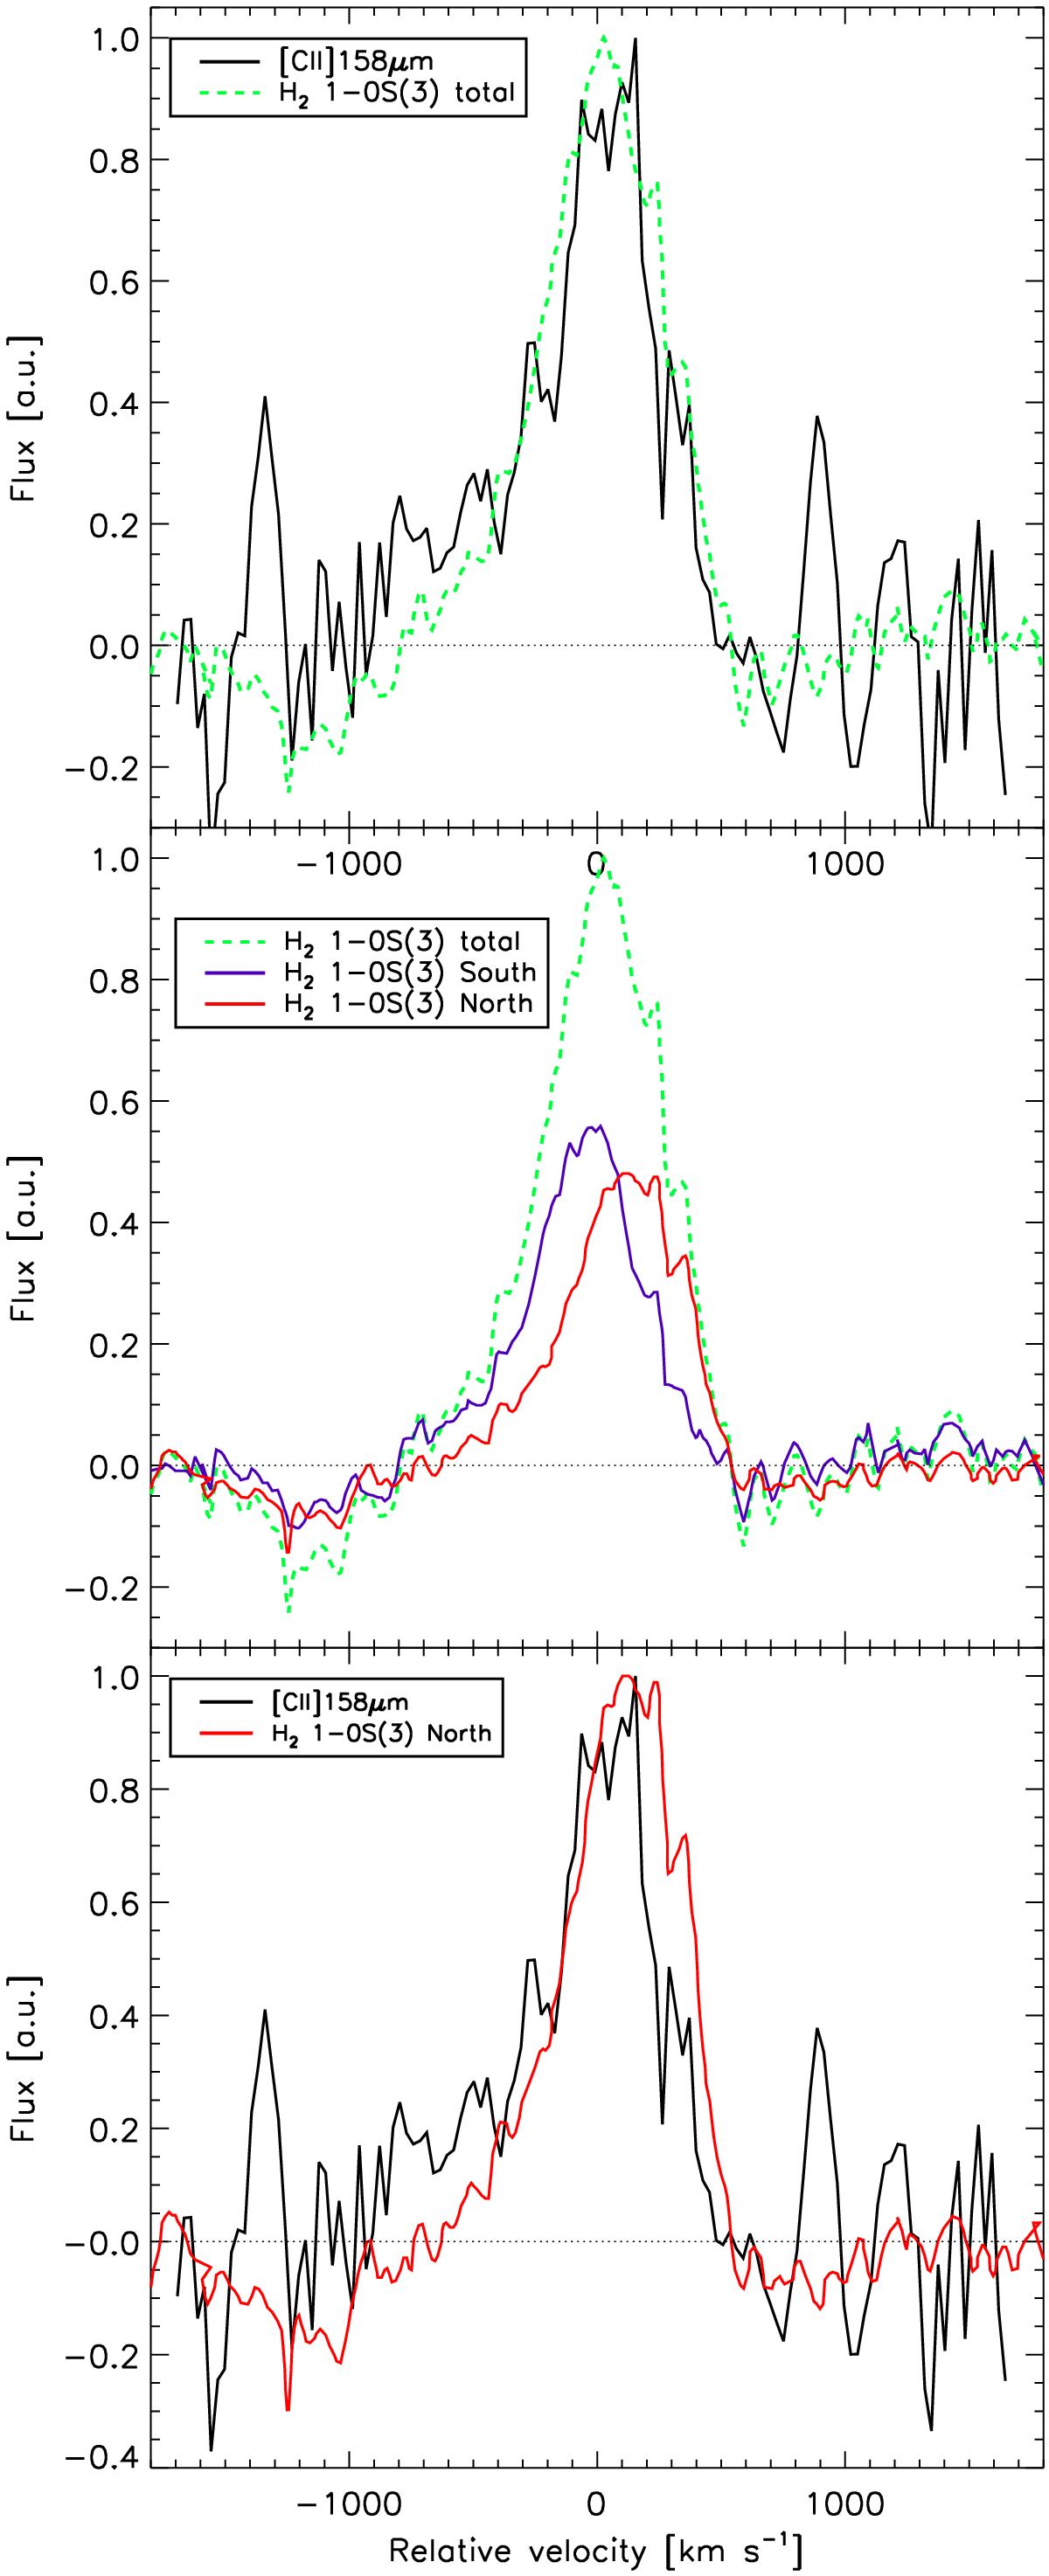
Comparison of the [Cii]λ158μm and H2 (1−0) S(3) line profiles in 3C 326N. All lines have been arbitrarily scaled (maximum line flux of 1) to facilitate a direct comparison. Top panel: comparison between [Cii] and the integrated H2 1−0S(3) 1.9576μm line profile (green dashed line). Central panel: total integrated H2 1−0S(3) line and decomposition of the H2 line emission originating from the northern disk hemisphere (red solid line) and the southern hemisphere (solid blue line), respectively. Bottom panel: the integrated [Cii] line profile (solid black line), and H2 line extracted from the northern hemisphere (solid red line).
Current usage metrics show cumulative count of Article Views (full-text article views including HTML views, PDF and ePub downloads, according to the available data) and Abstracts Views on Vision4Press platform.
Data correspond to usage on the plateform after 2015. The current usage metrics is available 48-96 hours after online publication and is updated daily on week days.
Initial download of the metrics may take a while.