Fig. 2
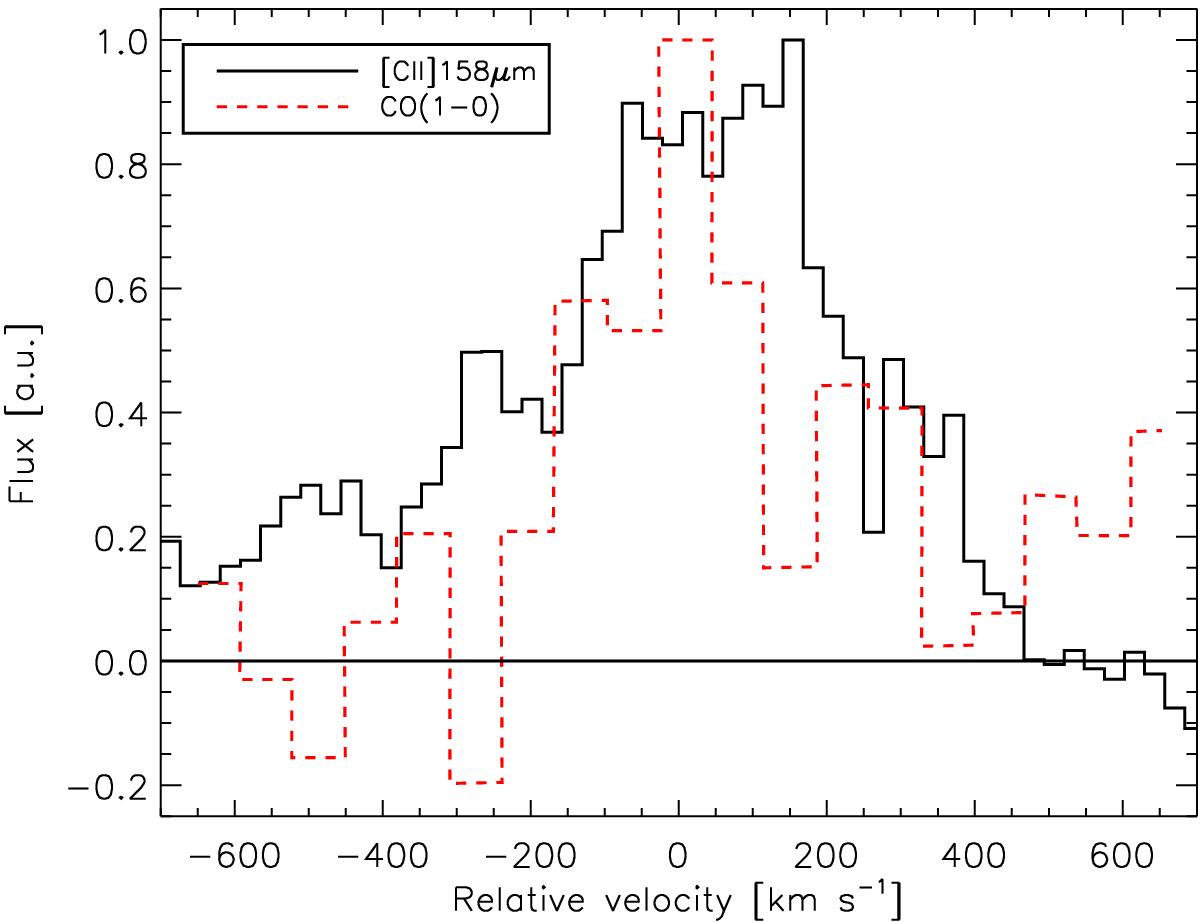
Comparison of the [Cii]λ158μm (solid black line) and CO(1−0) (red dashed line) line profiles in 3C 326N. The maximum flux for both spectra has been normalized to 1 to ease the comparison. The CO(1−0) data are from IRAM Plateau de Bure observations reported in Nesvadba et al. (2010). The reference recession velocity corresponds to a redshift z = 0.09002.
Current usage metrics show cumulative count of Article Views (full-text article views including HTML views, PDF and ePub downloads, according to the available data) and Abstracts Views on Vision4Press platform.
Data correspond to usage on the plateform after 2015. The current usage metrics is available 48-96 hours after online publication and is updated daily on week days.
Initial download of the metrics may take a while.