Fig. 1
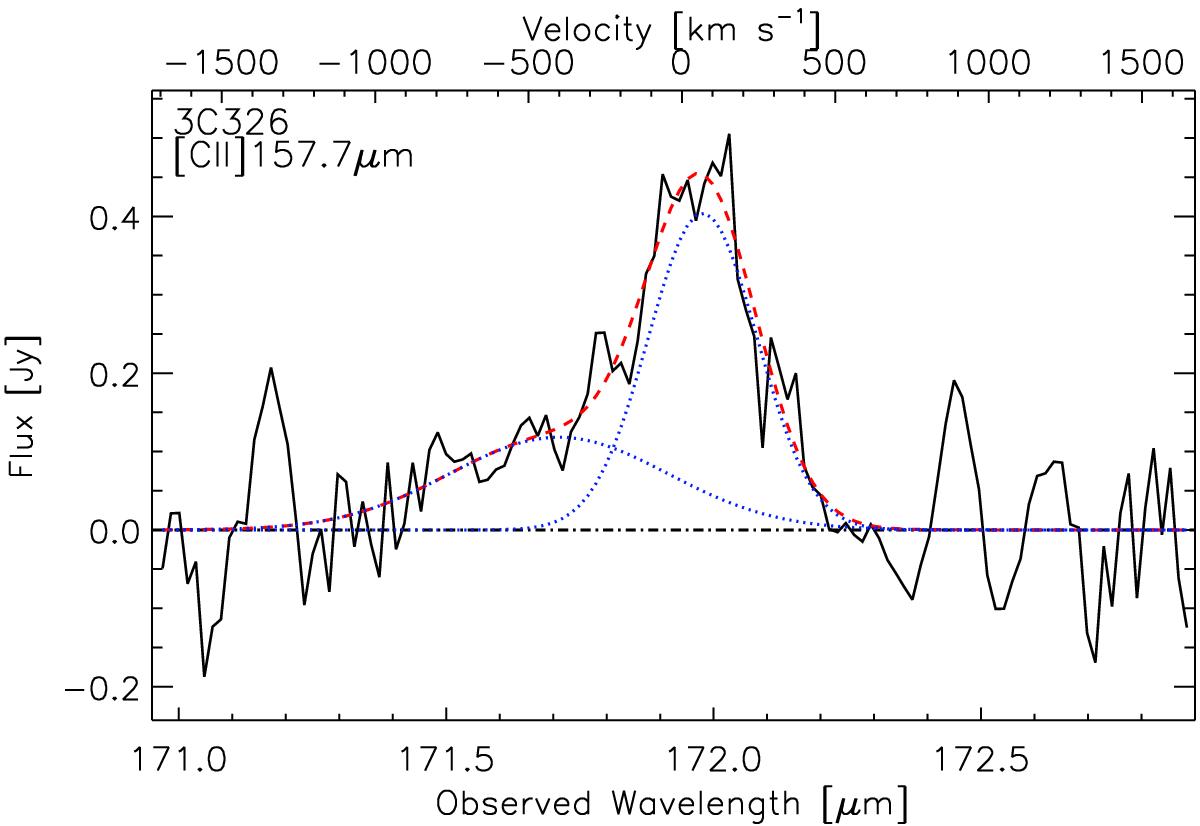
[Cii]λ158 μm spectrum in 3C 326N observed with Herschel/ PACS and obtained after combining the 3 × 3 central spaxels (see Sect. 2 for details). The reference recession velocity corresponds to a redshift z = 0.09002. The dotted blue lines show the two Gaussians decomposition, and the red dashed line shows the total fit. The fitted line parameters are gathered in Table 1, and the gas kinematics are discussed in Sect. 3. The two positive spurious features on each side of the line (at λ = 171.15 and 172.45 μm) have been masked to fit the line and the continuum.
Current usage metrics show cumulative count of Article Views (full-text article views including HTML views, PDF and ePub downloads, according to the available data) and Abstracts Views on Vision4Press platform.
Data correspond to usage on the plateform after 2015. The current usage metrics is available 48-96 hours after online publication and is updated daily on week days.
Initial download of the metrics may take a while.