Fig. 6
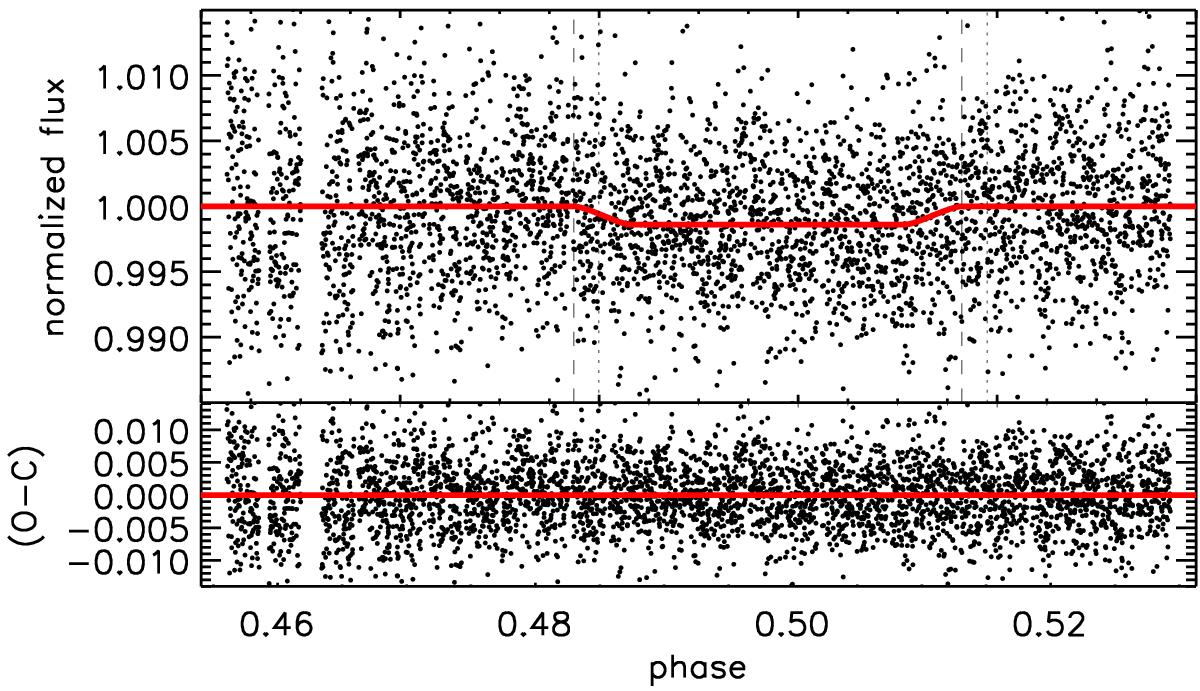
Secondary eclipse of WASP-10b in the Ks-band obtained in the joint-MCMC analysis. The small black circles show the unbinned data points. The solid line represents the best occultation model obtained from the joint-MCMC analysis, after removing the contribution of the systematics. The dotted lines illustrate the ingress and egress positions of the expected eclipse for a circular orbit, and the dashed lines show the phase shift given by the model. The residuals are presented in the lower panel.
Current usage metrics show cumulative count of Article Views (full-text article views including HTML views, PDF and ePub downloads, according to the available data) and Abstracts Views on Vision4Press platform.
Data correspond to usage on the plateform after 2015. The current usage metrics is available 48-96 hours after online publication and is updated daily on week days.
Initial download of the metrics may take a while.