Free Access
Fig. 5
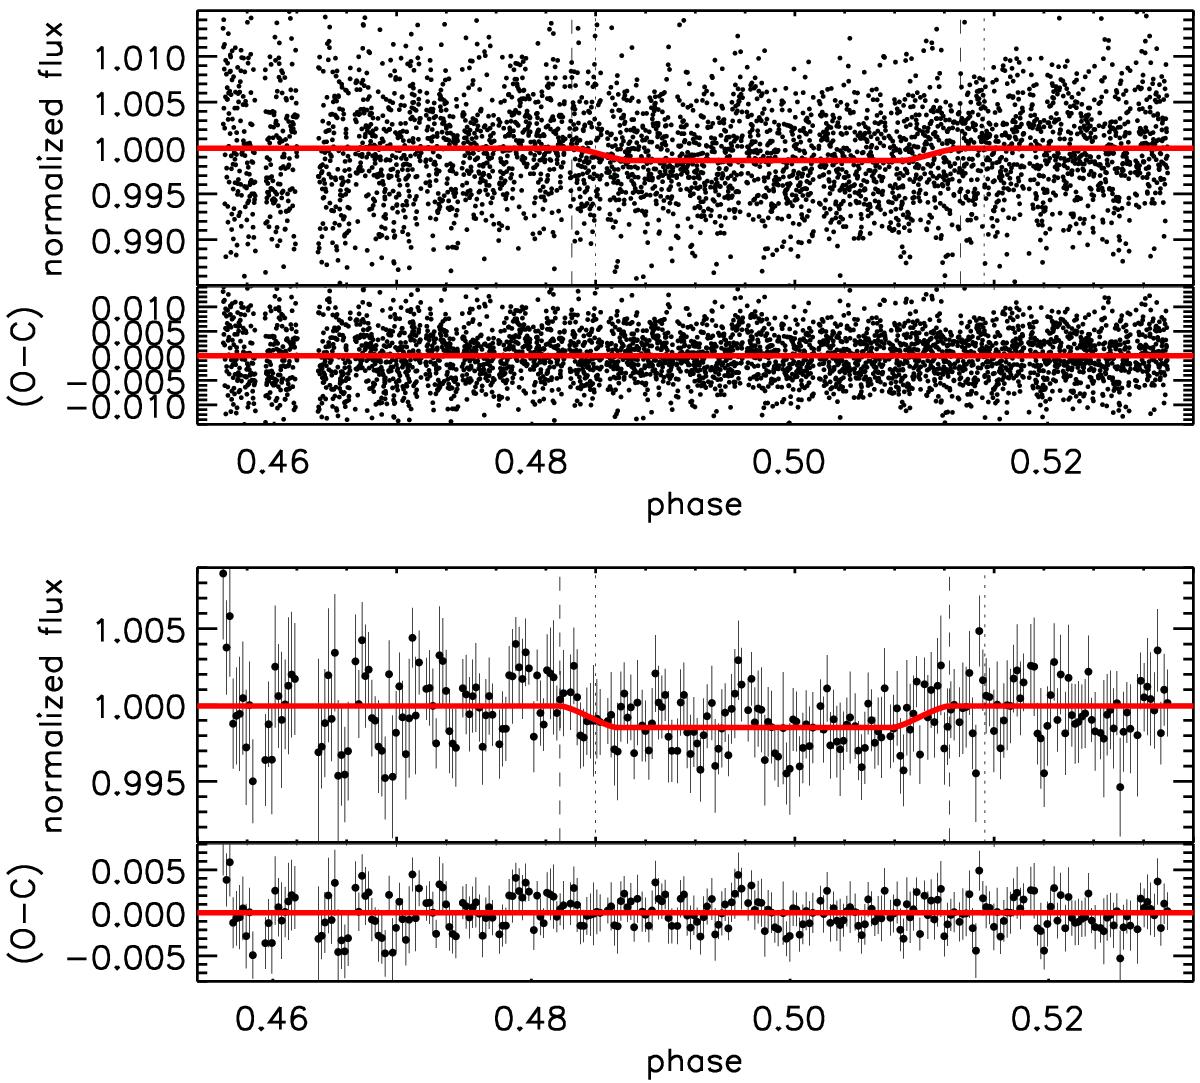
MCMC analyses for different bin sizes. From top to bottom, the black circles are the light curves with 1 (unbinned) and 15 points per bin (0.067 and 1 min per bin, respectively). The solid lines show the model obtained for each case, showing the coherence of the results.
This figure is made of several images, please see below:
Current usage metrics show cumulative count of Article Views (full-text article views including HTML views, PDF and ePub downloads, according to the available data) and Abstracts Views on Vision4Press platform.
Data correspond to usage on the plateform after 2015. The current usage metrics is available 48-96 hours after online publication and is updated daily on week days.
Initial download of the metrics may take a while.