Fig. 6
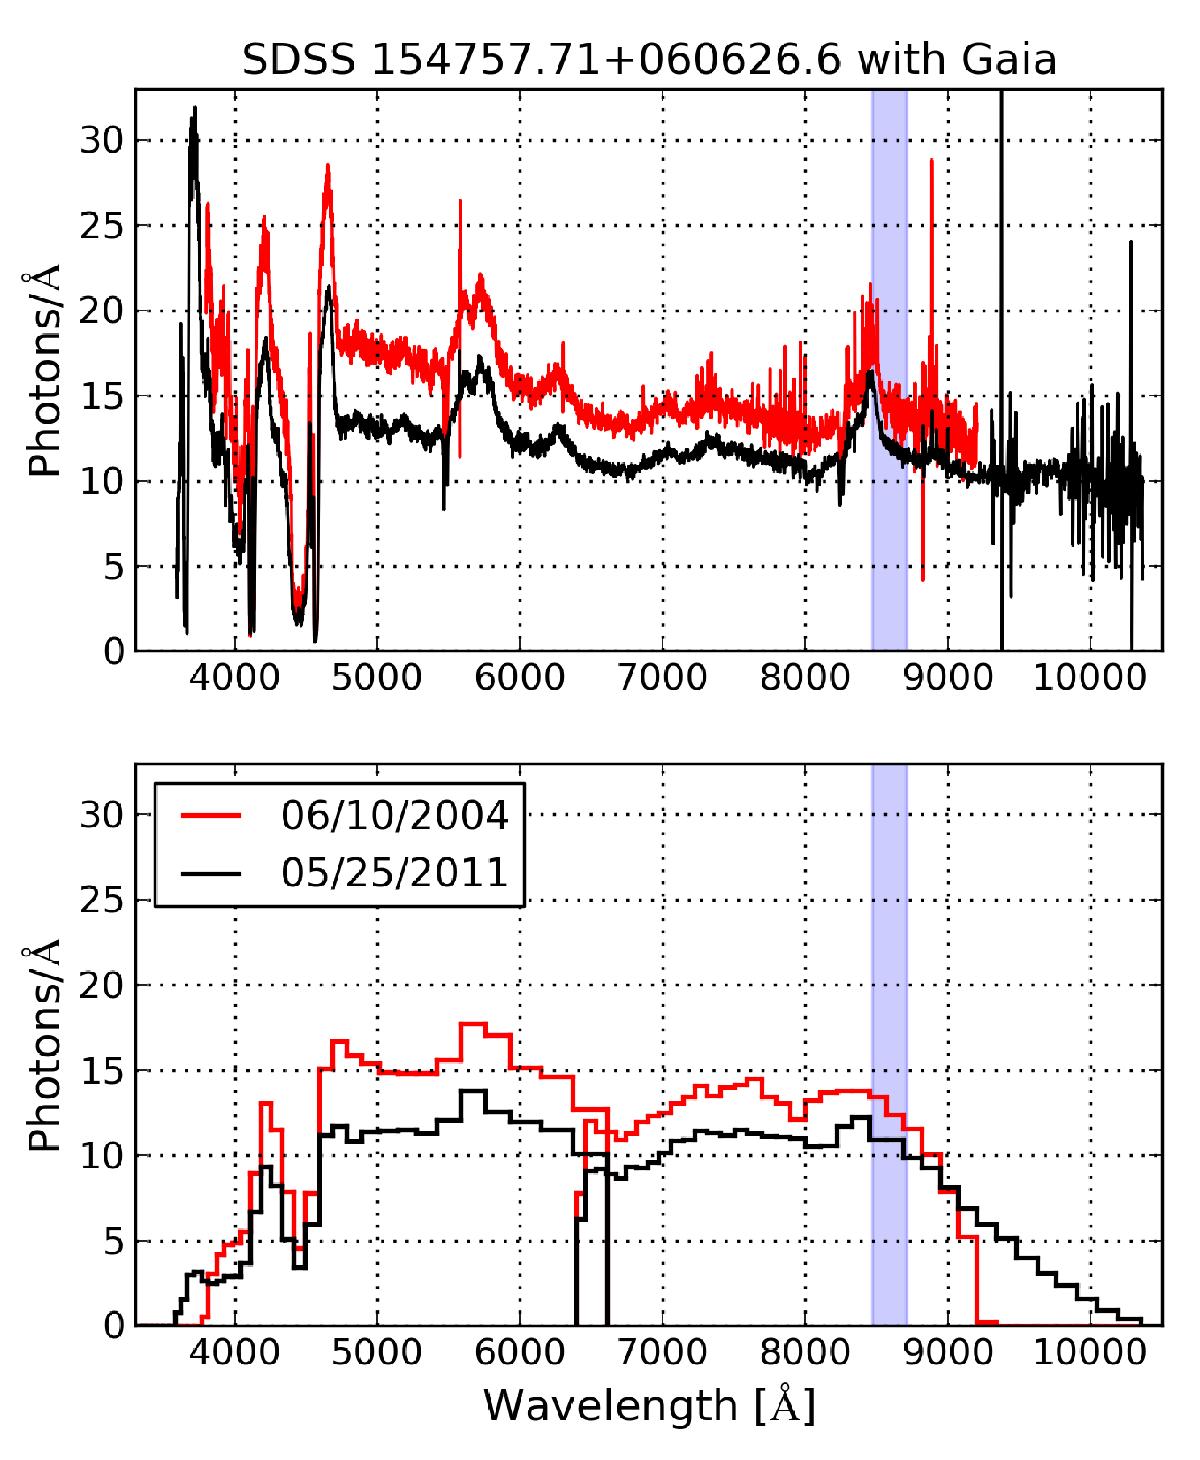
Upper panel: spectra of the variable quasar SDSS 154757.71+060626.6 (Scaringi et al. 2009) in May 25, 2011 (black), and in October 6, 2004 (red). Bottom panel: same quasar spectra convolved with Gaia’s low-resolution instrument including noise and a sequence of five single-field-of-view observations. Gaia can easily detect such strong variability.
Current usage metrics show cumulative count of Article Views (full-text article views including HTML views, PDF and ePub downloads, according to the available data) and Abstracts Views on Vision4Press platform.
Data correspond to usage on the plateform after 2015. The current usage metrics is available 48-96 hours after online publication and is updated daily on week days.
Initial download of the metrics may take a while.