Fig. 3
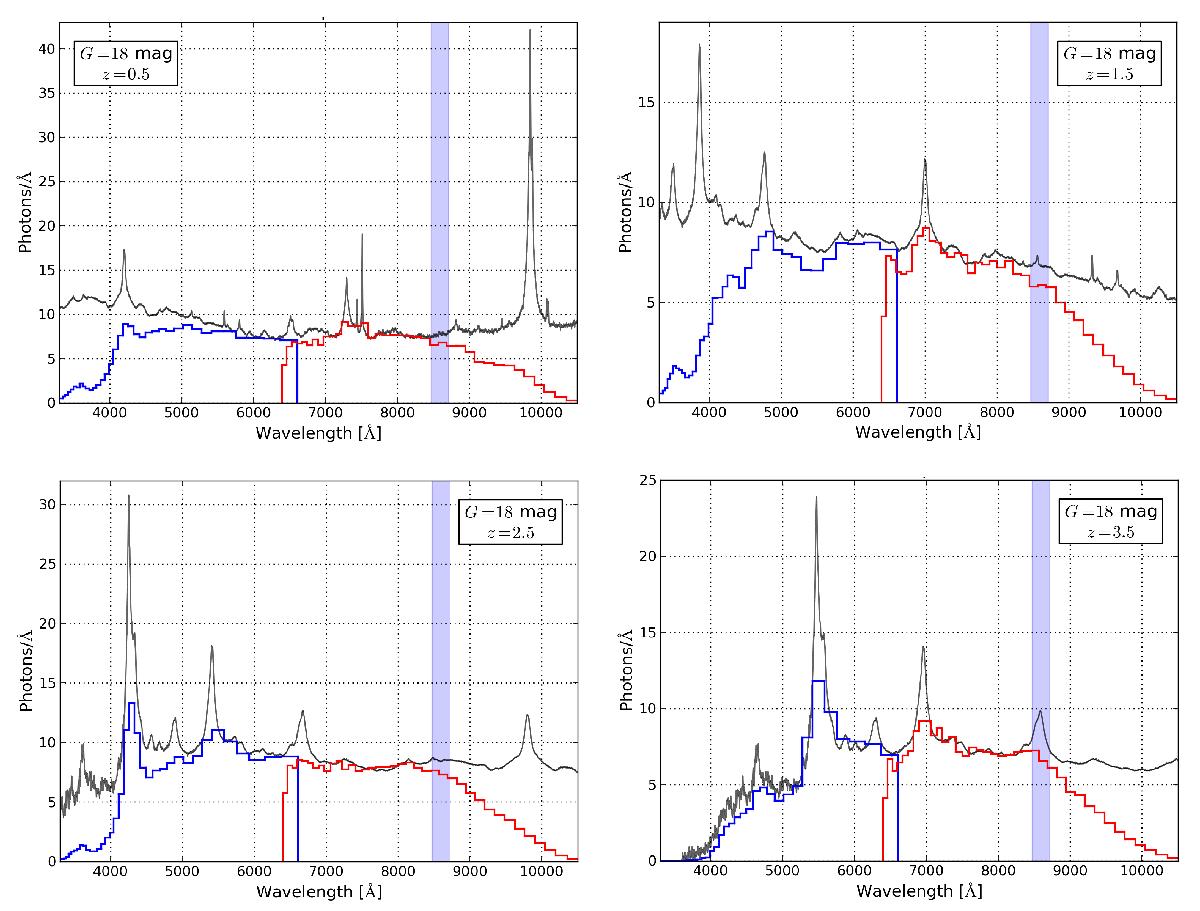
Composite quasar spectra (Vanden Berk et al. 2001), convolved with Gaia’s low-resolution of the Blue and Red Photometers (BP and RP), for the magnitude G = 18 and redshifts z = 0.5, 1.5, 2.5, and 3.5. We plotted the resulting redshifted quasar spectra (black), BP low-resolution (blue), and RP low-resolution (red) spectra for the Gaia wavelength range considering Poisson noise and the photon response curve by Jordi et al. (2010). The blue shaded area indicates the spectral region of the RVS (8470−8710 Å). There are about 37 data bins (Gaia: “samples”) for the blue photometer and 38 samples for the red photometer resulting in example spectra represented by blue and red bars. We applied a typical exposure time for five single field-of-view passages (5 × 4.42 s) in order to calculate the number of photons.
Current usage metrics show cumulative count of Article Views (full-text article views including HTML views, PDF and ePub downloads, according to the available data) and Abstracts Views on Vision4Press platform.
Data correspond to usage on the plateform after 2015. The current usage metrics is available 48-96 hours after online publication and is updated daily on week days.
Initial download of the metrics may take a while.