Fig. 3
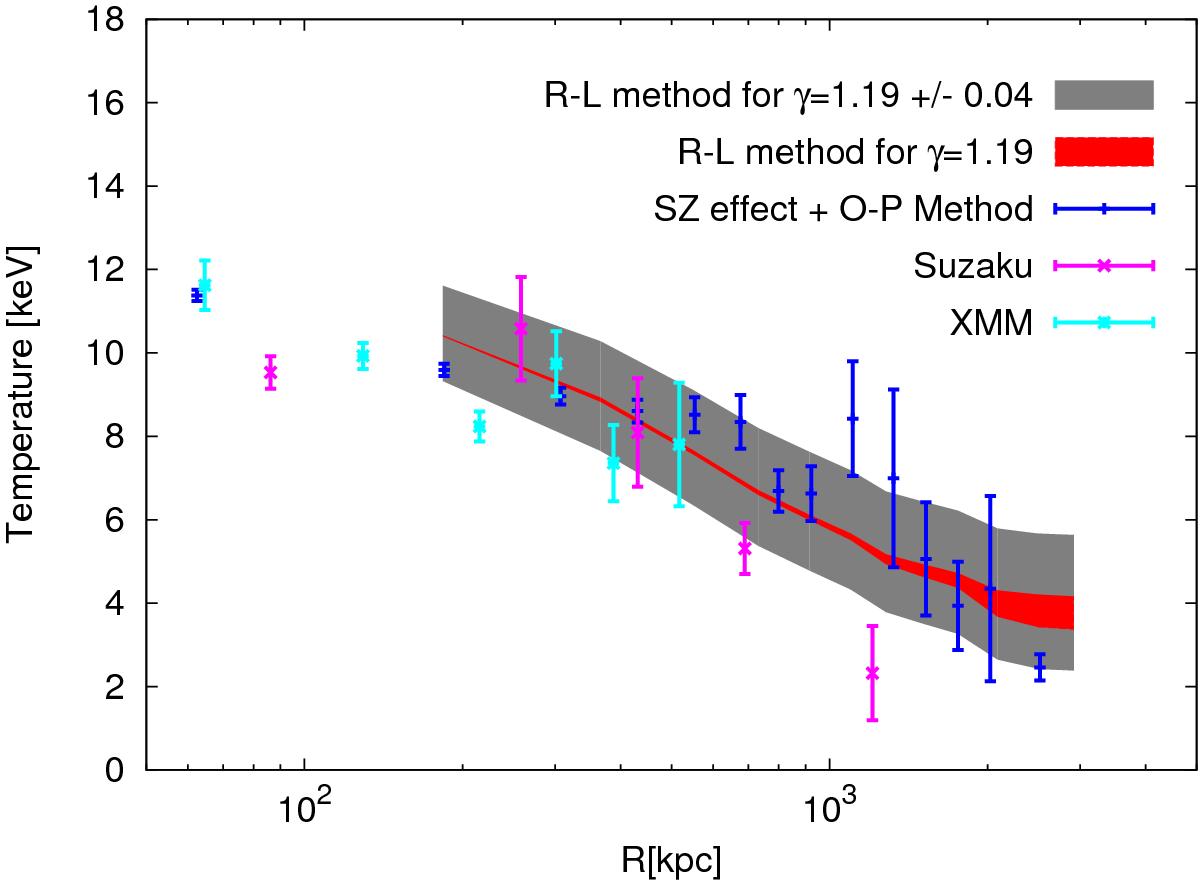
Temperature profile obtained from the R-L reconstructed emissivity profile via Eq. (6) with γ = 1.19 ± 0.04, compared to temperature profiles obtained using different techniques. Dark blue: profile derived from combined X-ray and thermal-SZ measurements (Planck Collaboration Int. V 2013) using the ideal gas assumption (Eckert et al. 2013); light blue: spectral fitting of XMM observations (Snowden et al. 2008); pink: spectral fitting of Suzaku observations (Kawaharada et al. 2010); red: mean value and errors on the reconstructed profile for γ = 1.19; gray: mean value and errors on the reconstructed profile for γ = 1.19 ± 0.04. The mean and the error bars were obtained with a Monte Carlo method based on the R-L deprojection. The reconstructed temperature profile has been normalized to the data points from Eckert et al. (2013) within a spherical shell delimited by the radii in the range [183; 2515] kpc.
Current usage metrics show cumulative count of Article Views (full-text article views including HTML views, PDF and ePub downloads, according to the available data) and Abstracts Views on Vision4Press platform.
Data correspond to usage on the plateform after 2015. The current usage metrics is available 48-96 hours after online publication and is updated daily on week days.
Initial download of the metrics may take a while.