Fig. 8
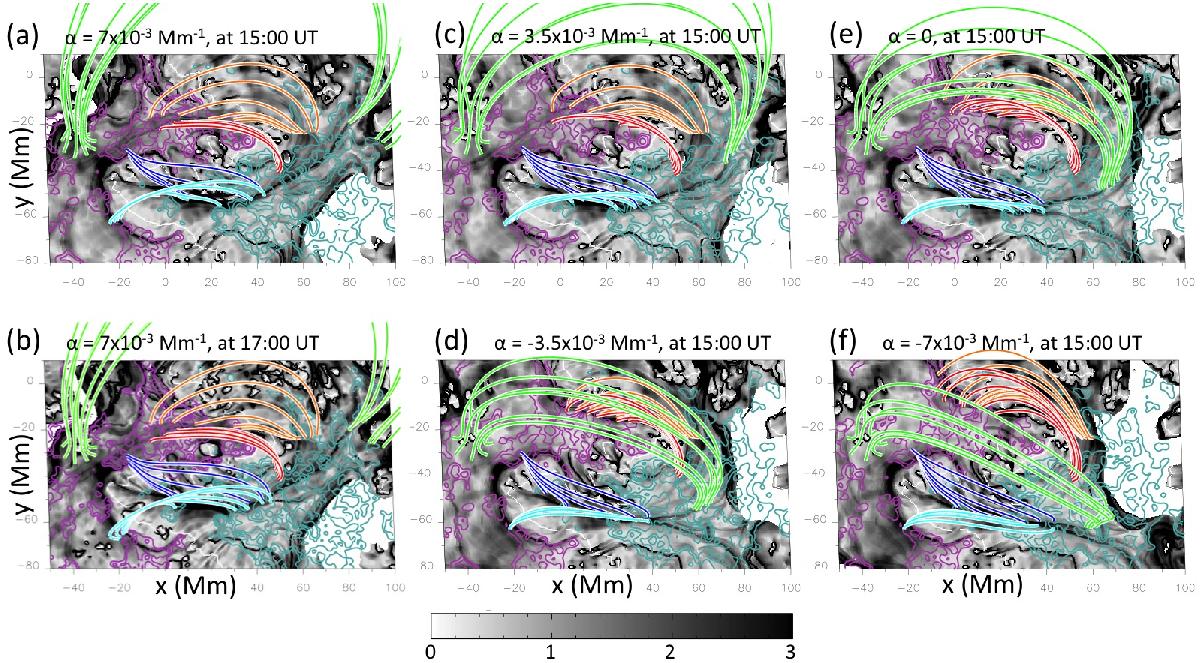
Selected field lines belonging to the three QSLs of NOAA 11589 identified in Fig. 6b, for the same extrapolations as in Fig. 7. Red/orange, dark/light-blue, and green field lines respectively belong to Q1, Q2, and Q3. The gray scale displays the photospheric map of the squashing degree, Q. Solid purple/cyan lines are isocontours of the photospheric vertical magnetic field, Bz = [ 150,300,600 ] Gauss.
Current usage metrics show cumulative count of Article Views (full-text article views including HTML views, PDF and ePub downloads, according to the available data) and Abstracts Views on Vision4Press platform.
Data correspond to usage on the plateform after 2015. The current usage metrics is available 48-96 hours after online publication and is updated daily on week days.
Initial download of the metrics may take a while.