Fig. 6
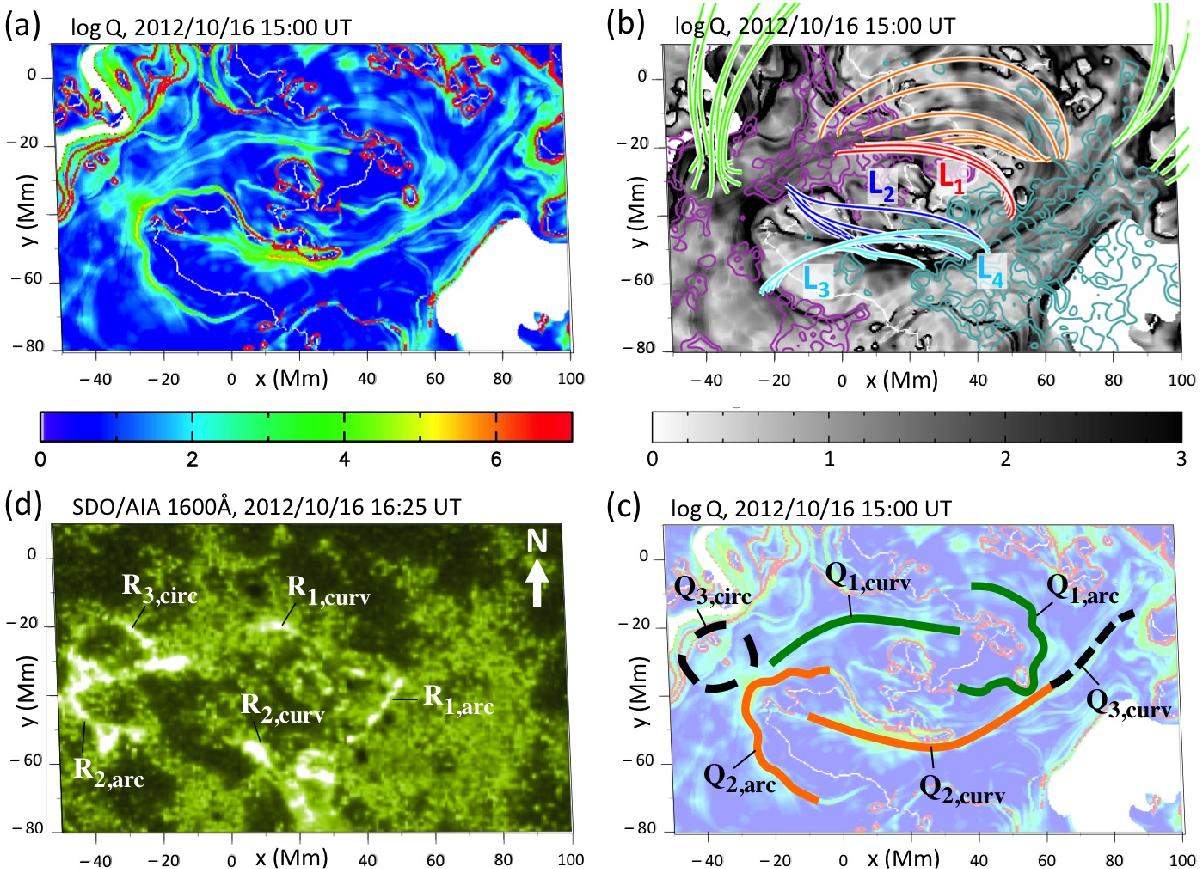
Zoom on NOAA 11589. a) Photospheric mapping of QSLs from the computation of the squashing degree, Q. White regions are related to magnetic field lines that are open on the scale of the extrapolation domain and where Q is not computed. b) Selected magnetic field lines and c) photospheric footprints of the identified QSLs plotted over the photospheric Q-map. The field lines labeled Li = { 1,2,3,4 } indicate possible candidates for the four post-flare loops labeled in Fig. 4. d) Flare ribbons labeled with respect to the identified QSLs footprints. The white arrow indicates the northern direction.
Current usage metrics show cumulative count of Article Views (full-text article views including HTML views, PDF and ePub downloads, according to the available data) and Abstracts Views on Vision4Press platform.
Data correspond to usage on the plateform after 2015. The current usage metrics is available 48-96 hours after online publication and is updated daily on week days.
Initial download of the metrics may take a while.