Fig. 1
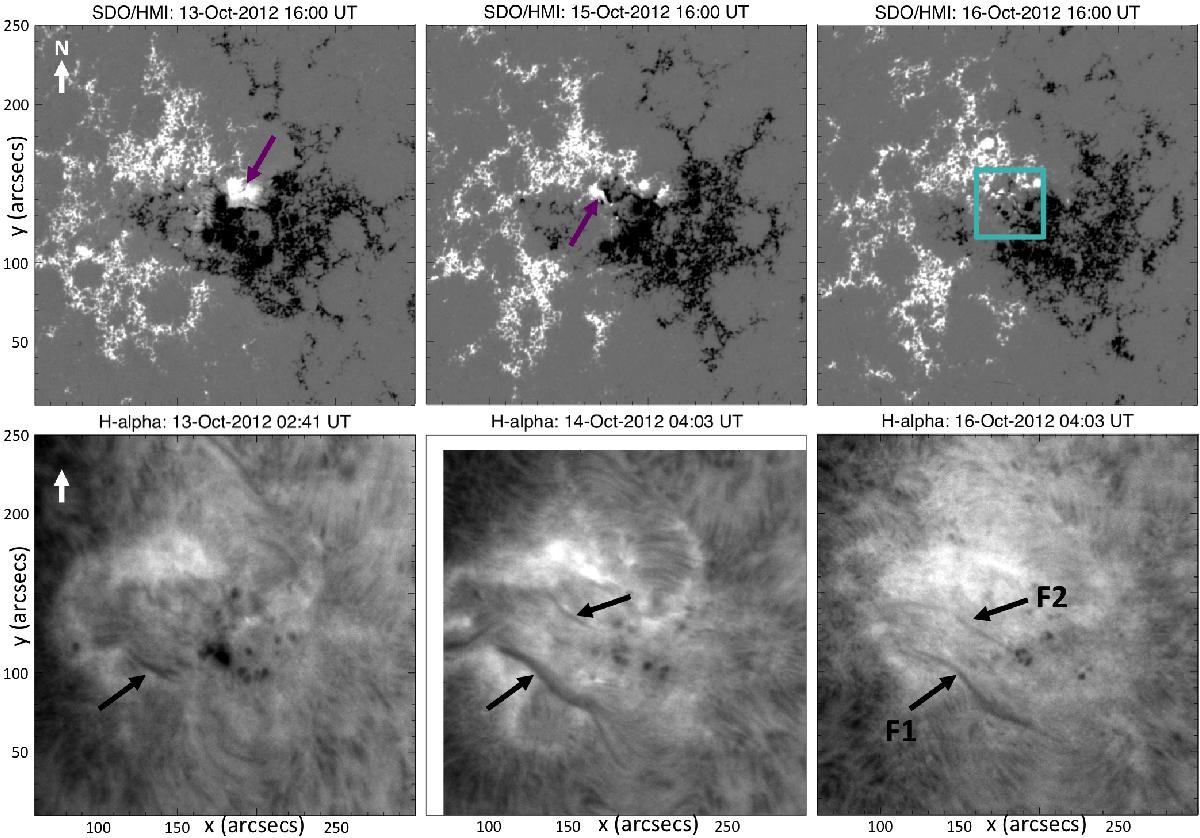
Evolution of active region NOAA 11589 during its disk passage before the eruption on 2012 October 16. Top: evolution of the longitudinal magnetic field observed by SDO/HMI. White/black are positive/negative polarities. The field strength is saturated at 500 Gauss. The violet arrows indicate significant emerging fluxes on October 13 and 15. The cyan rectangle highlights the region where recurring magnetic flux emergence occurred on October 16 and likely triggered the studied C3-class flare (see Sect. 2.4). The temporal evolution of the magnetograms is available as a movie in the online edition. Bottom: development of filaments in Hα observed by ARIES telescope. The locations of two observed filaments F1 and F2 are indicated by black arrows. The white arrow indicates the north direction.
Current usage metrics show cumulative count of Article Views (full-text article views including HTML views, PDF and ePub downloads, according to the available data) and Abstracts Views on Vision4Press platform.
Data correspond to usage on the plateform after 2015. The current usage metrics is available 48-96 hours after online publication and is updated daily on week days.
Initial download of the metrics may take a while.