Free Access
Fig. 8
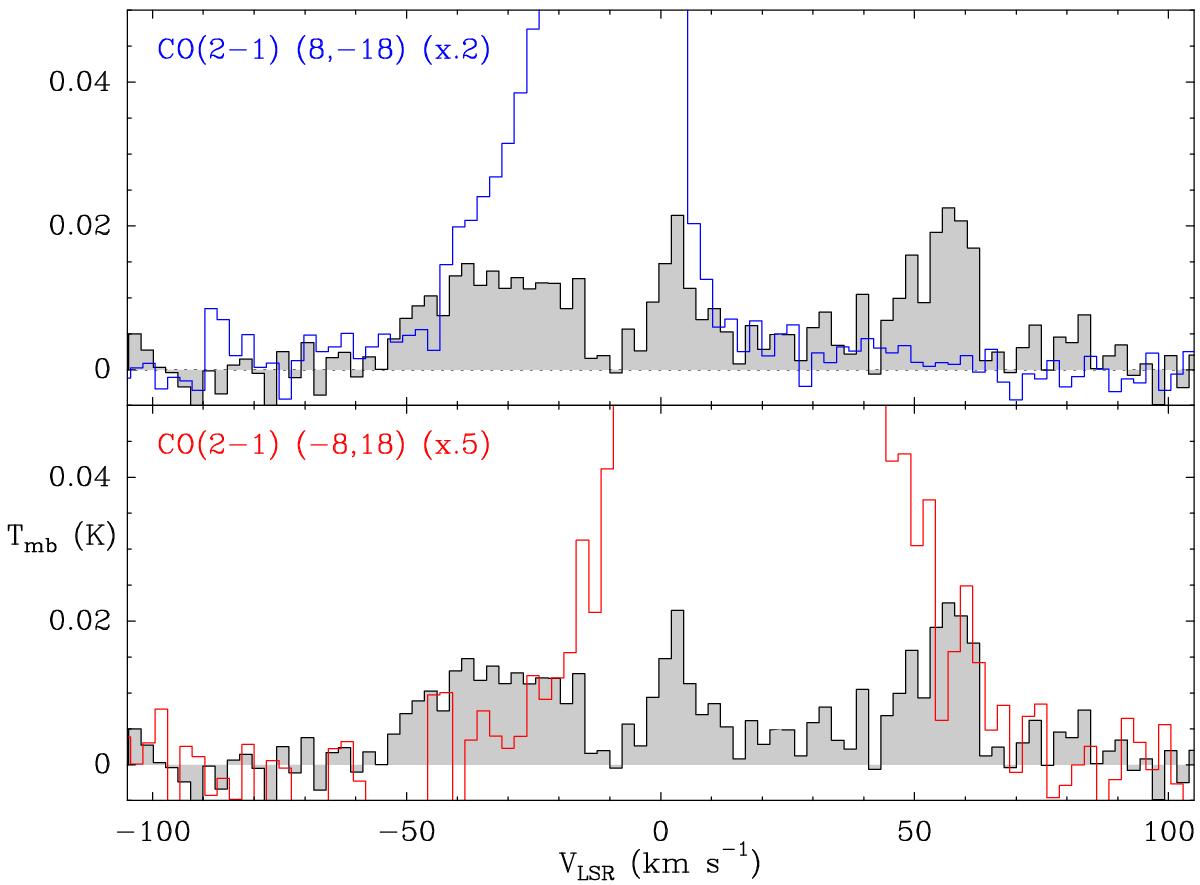
On-source SiO(5–4) spectrum versus CO(2–1) spectra 20′′ from the source. In each panel, the SiO(5–4) spectrum toward L1157-mm is shown in gray and the CO(2–1) spectra at positions 20′′ away from L1157-mm are shown in color.
Current usage metrics show cumulative count of Article Views (full-text article views including HTML views, PDF and ePub downloads, according to the available data) and Abstracts Views on Vision4Press platform.
Data correspond to usage on the plateform after 2015. The current usage metrics is available 48-96 hours after online publication and is updated daily on week days.
Initial download of the metrics may take a while.