Free Access
Fig. 5
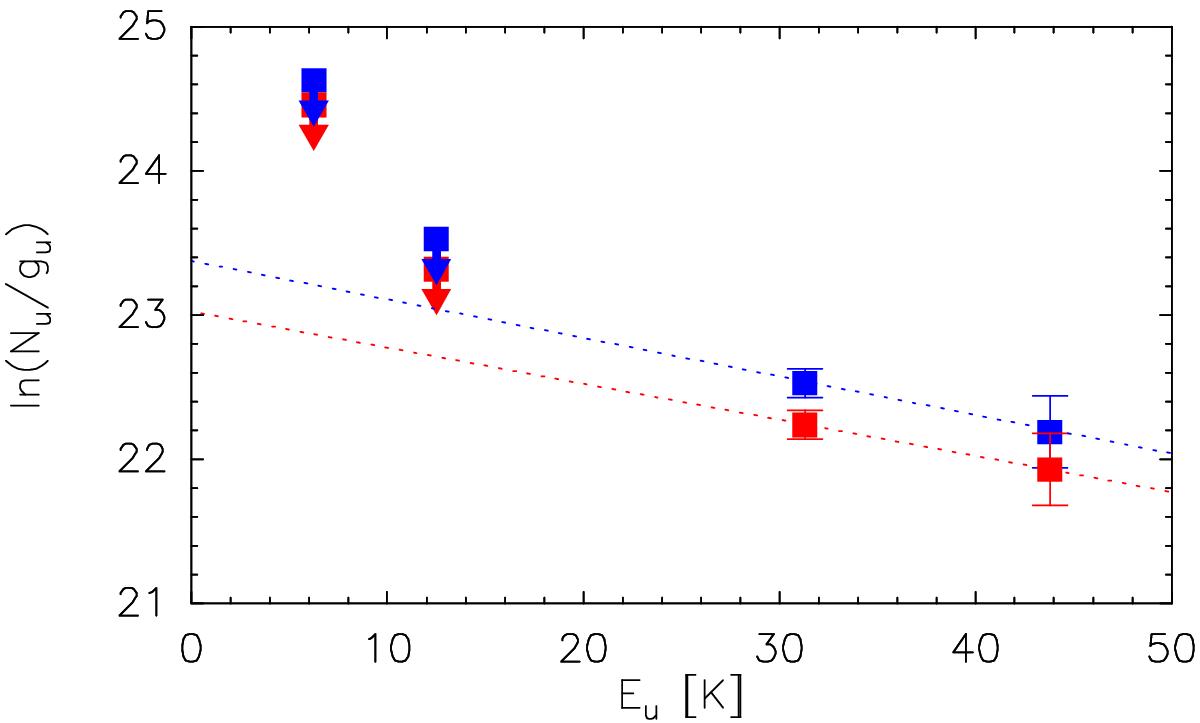
Population diagram of the EHV SiO toward L1157-mm. The blue and red symbols represent blue and red EHV gas. The dashed lines represent two LTE fits consistent with the detections in SiO(5–4) and SiO(6–5) and with the 3-sigma upper limits in SiO(2–1) and SiO(3–2) (downward pointing arrows). See text for fit results.
Current usage metrics show cumulative count of Article Views (full-text article views including HTML views, PDF and ePub downloads, according to the available data) and Abstracts Views on Vision4Press platform.
Data correspond to usage on the plateform after 2015. The current usage metrics is available 48-96 hours after online publication and is updated daily on week days.
Initial download of the metrics may take a while.